An order block is a price zone on a chart where institutional buying or selling occurred just before a sharp, impulsive price move. In practice, it is identified as the last bearish candle before a strong rally (a bullish order block) or the last bullish candle before a strong decline (a bearish order block). These zones act as high-probability areas of support or resistance because large players, institutions, market makers, and algorithmic funds often return to them to add to their positions. Order blocks are a core concept in Smart Money Concepts (SMC) and ICT trading methodology.
In this guide, you will learn what order blocks are, the psychology behind them, how to identify bullish and bearish order blocks on a BTC/USDT chart, how to build a trade setup around them, and how to apply them on BingX.
What Is an Order Block and How Does It Work?
Think of an order block as a footprint left behind by institutional money.
When a large institution wants to buy a significant amount of Bitcoin, they cannot place one massive market order without pushing the price up against themselves. Instead, they spread their buying across a zone, accumulating quietly over multiple candles while the market appears to be moving sideways or drifting slightly lower. Then, once they have filled their position, they push the price sharply upward using the remainder of their order flow.
The result on the chart: a brief consolidation or small downward drift, followed by a sudden strong impulsive move up. The zone where the accumulation happened is the order block and because the institution still has unfilled orders sitting at those levels, price tends to react strongly if it returns to that area.
The same logic applies in reverse for bearish order blocks, institutional selling followed by a sharp drop, with the selling zone likely to act as resistance on any bounce.
Order Block vs. Regular Support and Resistance: Key Differences
Order blocks look similar to traditional support and resistance zones but have a key distinction:
|
Feature |
Regular S&R |
Order Block |
|---|---|---|
|
What creates it |
Any cluster of price reactions |
Last candle before a specific impulsive move |
|
Why it holds |
Market memory and retail traders |
Unfilled institutional orders remaining at the level |
|
How to identify it |
Horizontal price clusters |
The specific candle(s) immediately before displacement |
|
Precision |
Zone-based, often wide |
More precise — tied to a specific candle's range |
|
Context needed |
Any price level |
Requires a preceding trend + impulsive move away |
What Is a Bullish Order Book and How to Identify It?
A bullish order block is the last bearish candle or the last cluster of bearish candles immediately before a strong impulsive move upward. It represents the zone where institutional buyers were quietly accumulating before launching price higher.
Visual Characteristics of a Bullish Order Block
- Appears during a downtrend or at the bottom of a pullback
- The last red (bearish) candle or group of small red candles before a sharp, decisive green move
- The impulsive move after must be significant, not a small bounce, a clear displacement
- Often accompanied by decreasing volume during the formation and a volume spike on the impulsive move away
How to Draw a Bullish Order Block on Your Crypto Chart
- Find a strong impulsive bullish move, a sharp rally of at least 2–3 strong green candles
- Look left to identify the last bearish candle immediately before that rally began
- Draw a rectangle from the high to the low of that candle or those candles if multiple
- This rectangle is your bullish order block zone
- The zone becomes active when price later returns to it, watch for a reaction like a bounce, rejection, or reversal signal
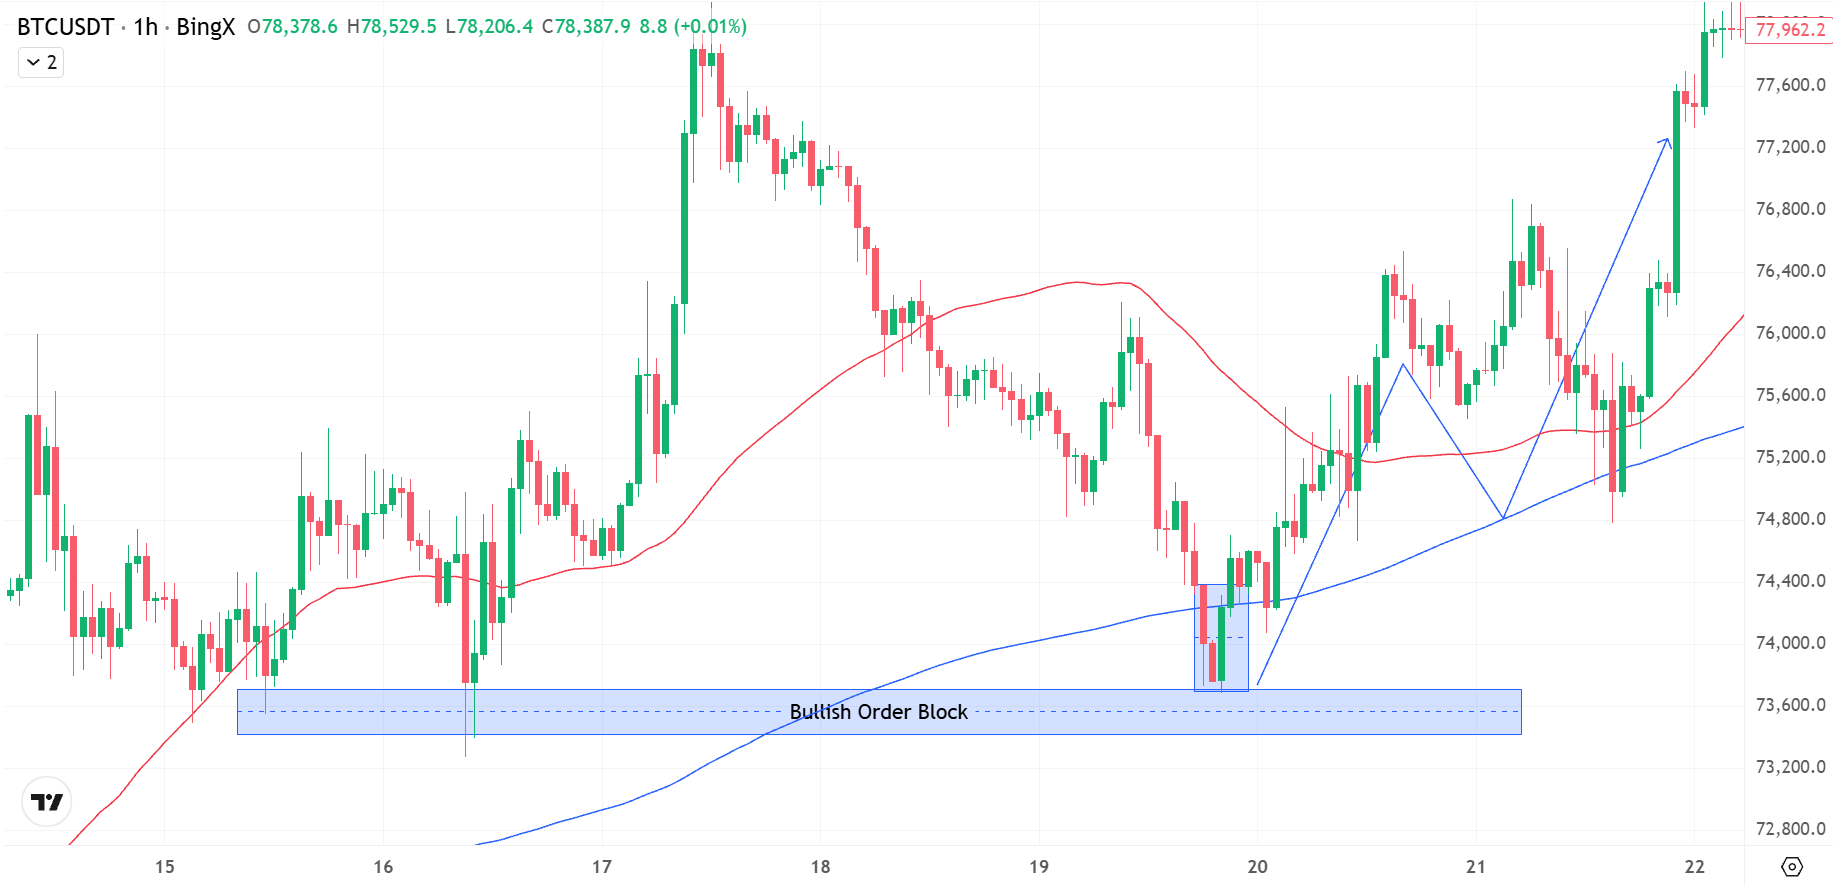
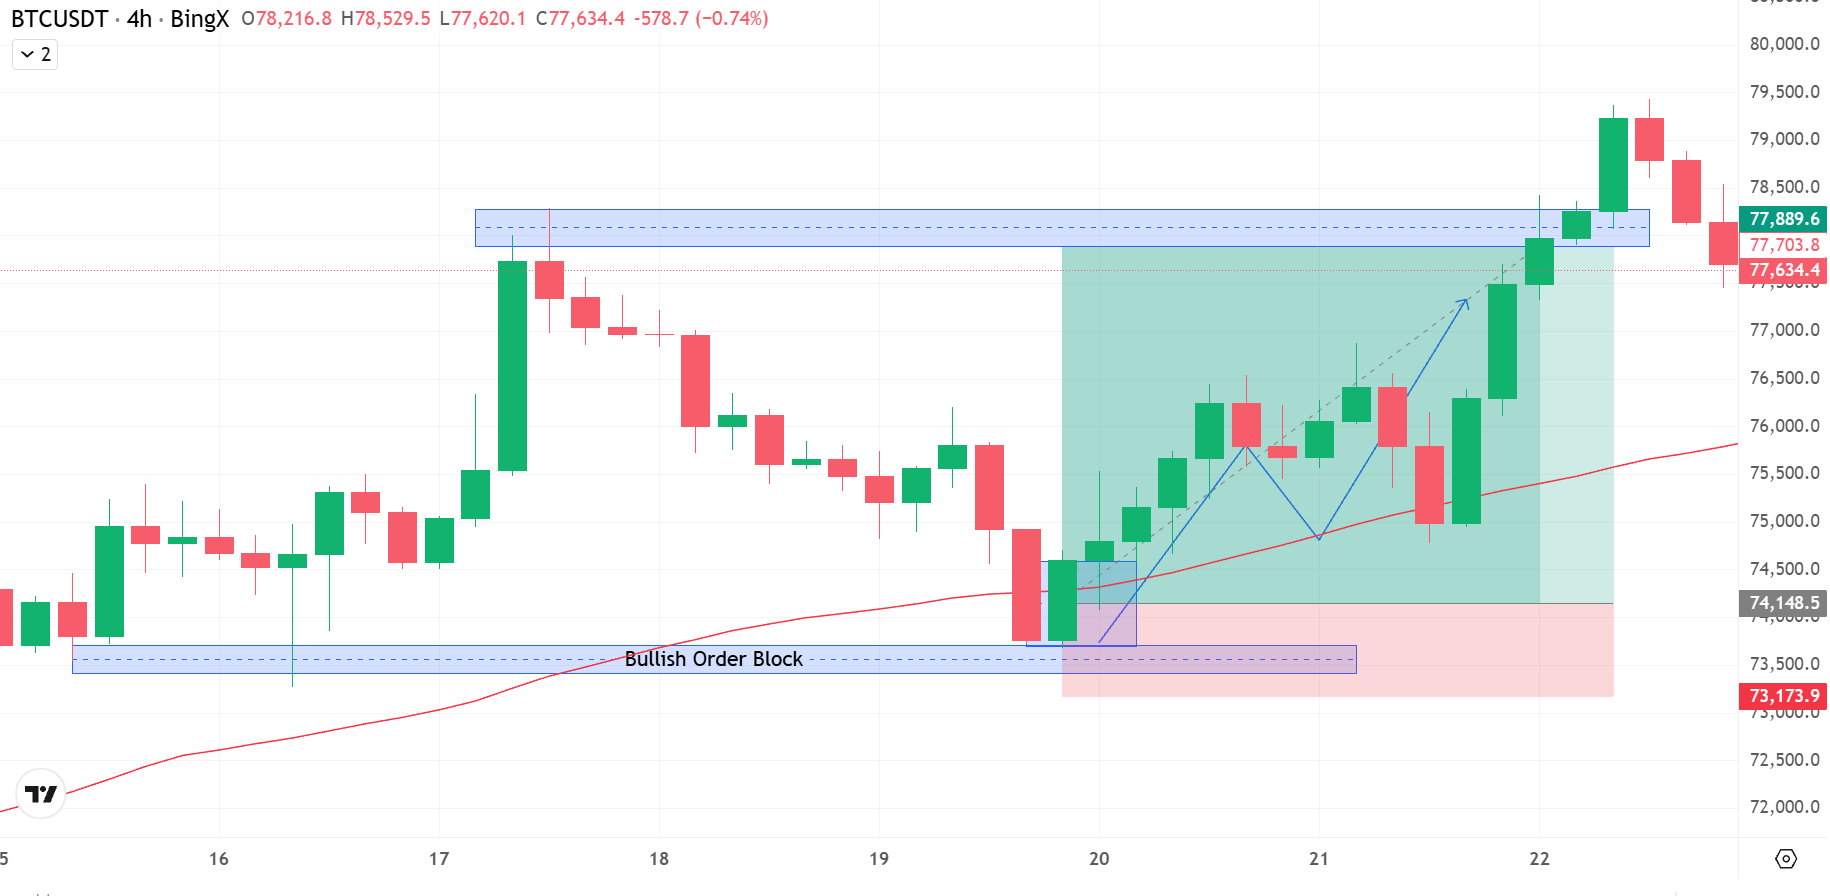
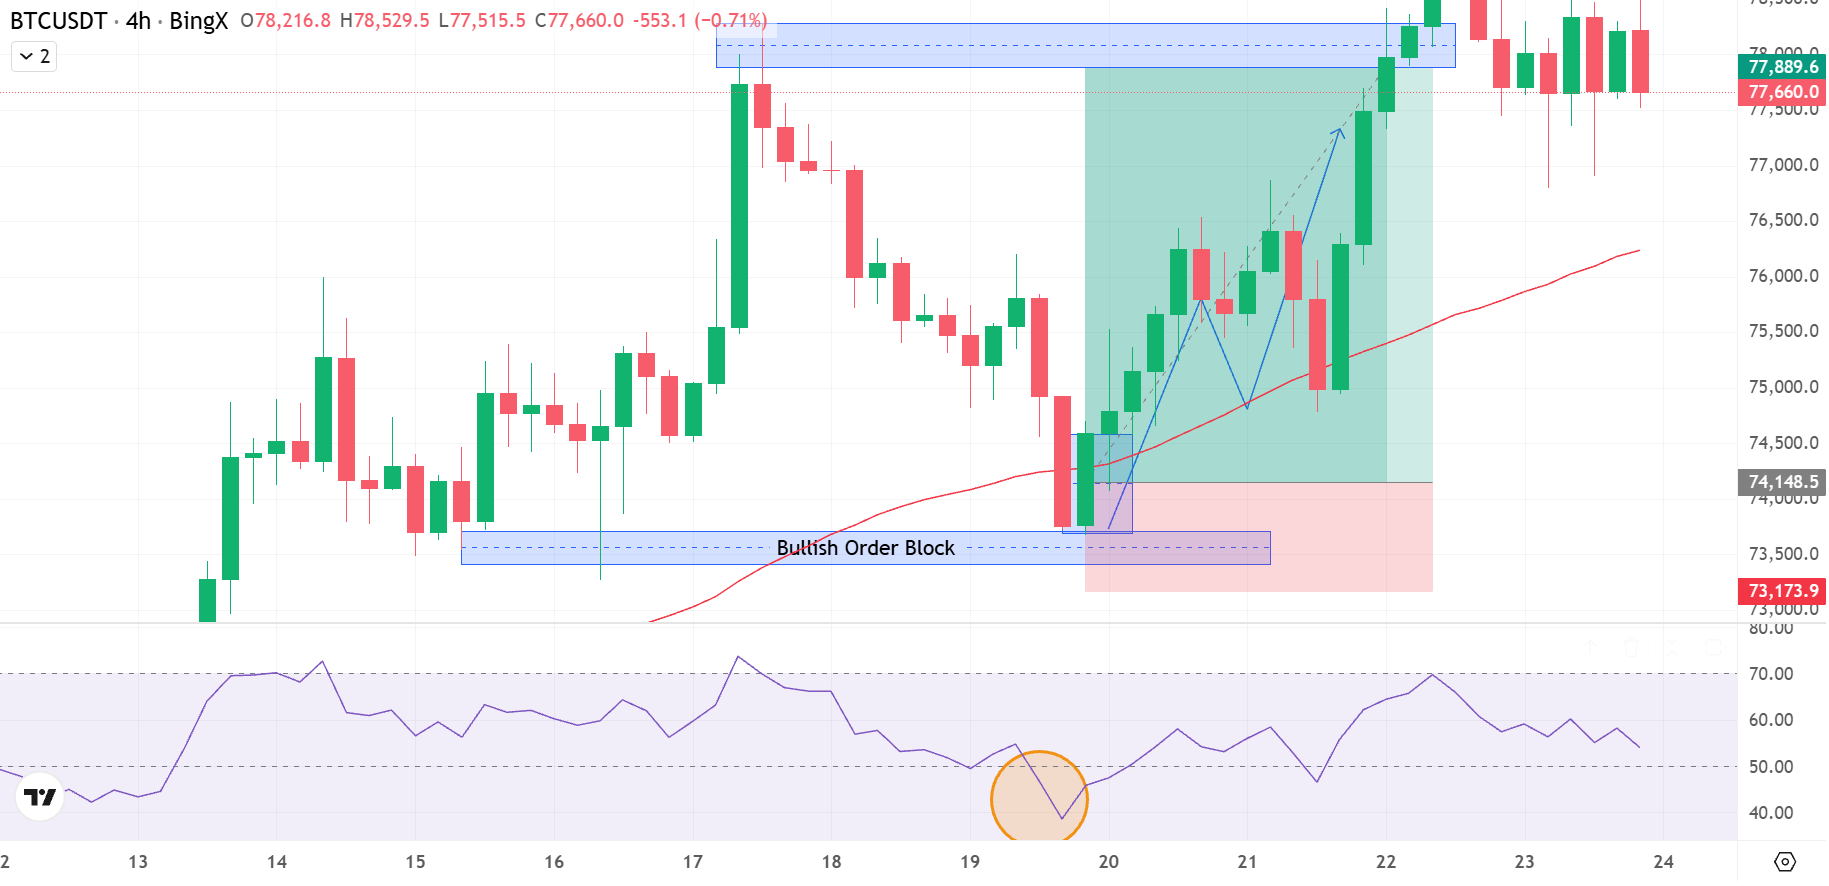
Bullish OB formation on BTC/USDT 1H - Source: BingX
For example, on the chart above, Bitcoin formed a textbook bullish order block on the 1-hour chart in the $73,500–$74,200 zone, marking the last bearish candle before a sharp institutional buying impulse. Price tapped into this demand area near the ascending trendline support, with RSI reaching oversold territory, triggering a swift recovery toward $76,500+. This reaction confirms smart money accumulation at the zone, making it a high-confluence bullish OB setup.
What Makes a Bullish Order Block Valid?
Not every bearish candle before a rally is a meaningful order block. Look for these qualities:
- Clear downtrend or pullback preceding the zone
- Strong impulsive move away, at least 2–3 large bullish candles following the OB
- The OB has not been revisited and closed through (if price already went through it, the OB is invalidated)
- Structural significance, forms near a previous swing low or key support level
- Higher timeframe alignment, a 4H OB within a daily uptrend is stronger than a 4H OB against the daily trend
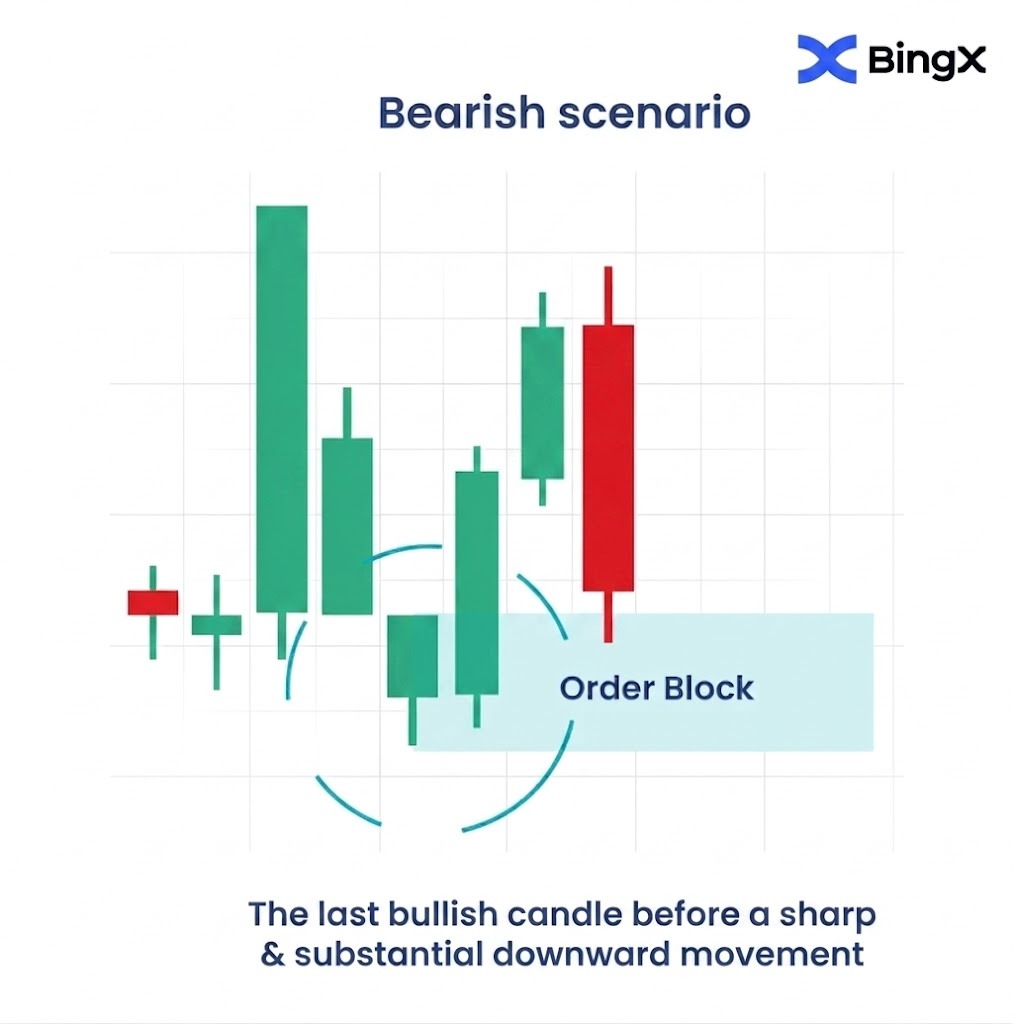
What Is a Bearish Order Block and How to Identify It?
A bearish order block is the last bullish candle (or last cluster of bullish candles) immediately before a strong impulsive move downward. It represents the zone where institutional sellers were quietly distributing before pushing price sharply lower.
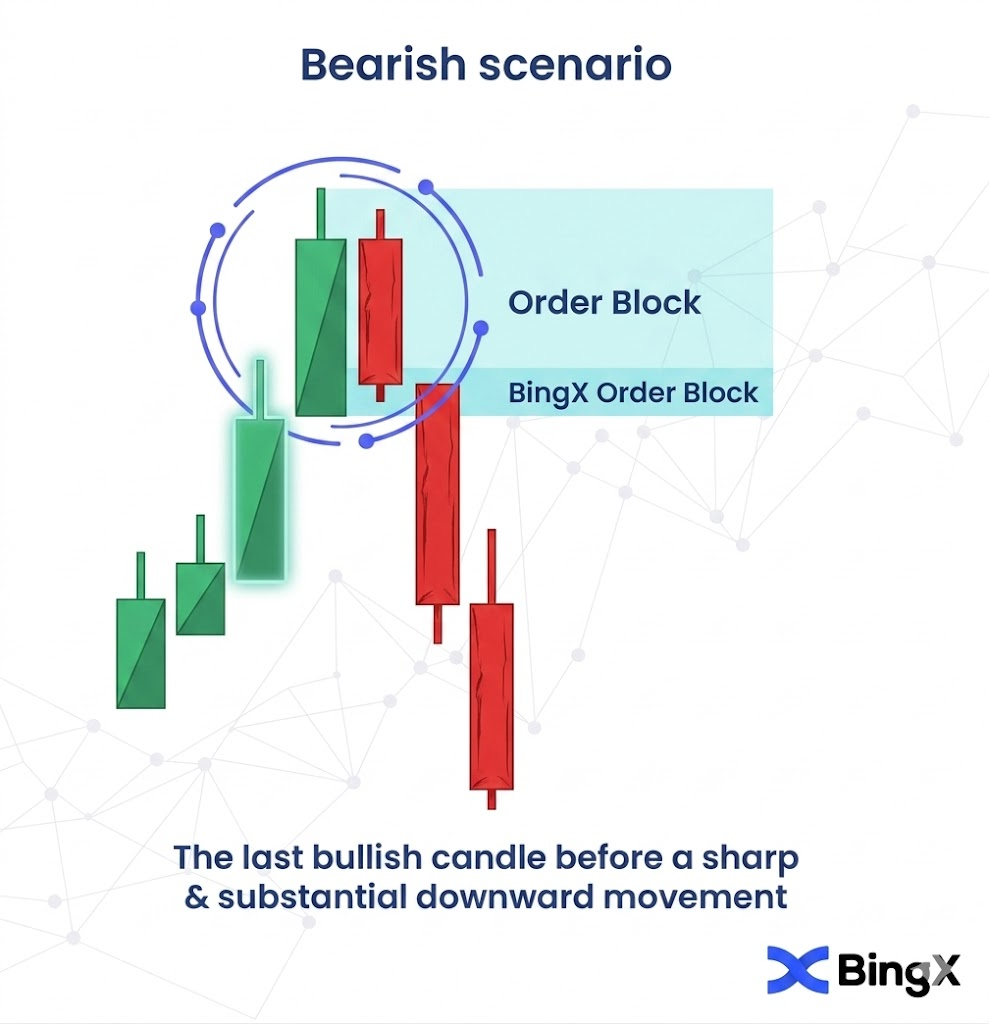
Visual Characteristics of a Bearish Order Block
- Appears during an uptrend or at the top of a rally
- The last green (bullish) candle or group of small green candles before a sharp, decisive red move
- The impulsive move after must be significant, a clear displacement, not a small dip
- Often accompanied by decreasing volume during the formation and a volume spike on the impulsive move away
How to Draw a Bearish Order Block on Your Chart
- Find a strong impulsive bearish move, a sharp decline of at least 2–3 strong red candles
- Look left to identify the last bullish candle immediately before that decline began
- Draw a rectangle from the high to the low of that candle or those candles
- This rectangle is your bearish order block zone
- The zone becomes active when price later returns to it, watch for a reaction like rejection, reversal, or continuation lower
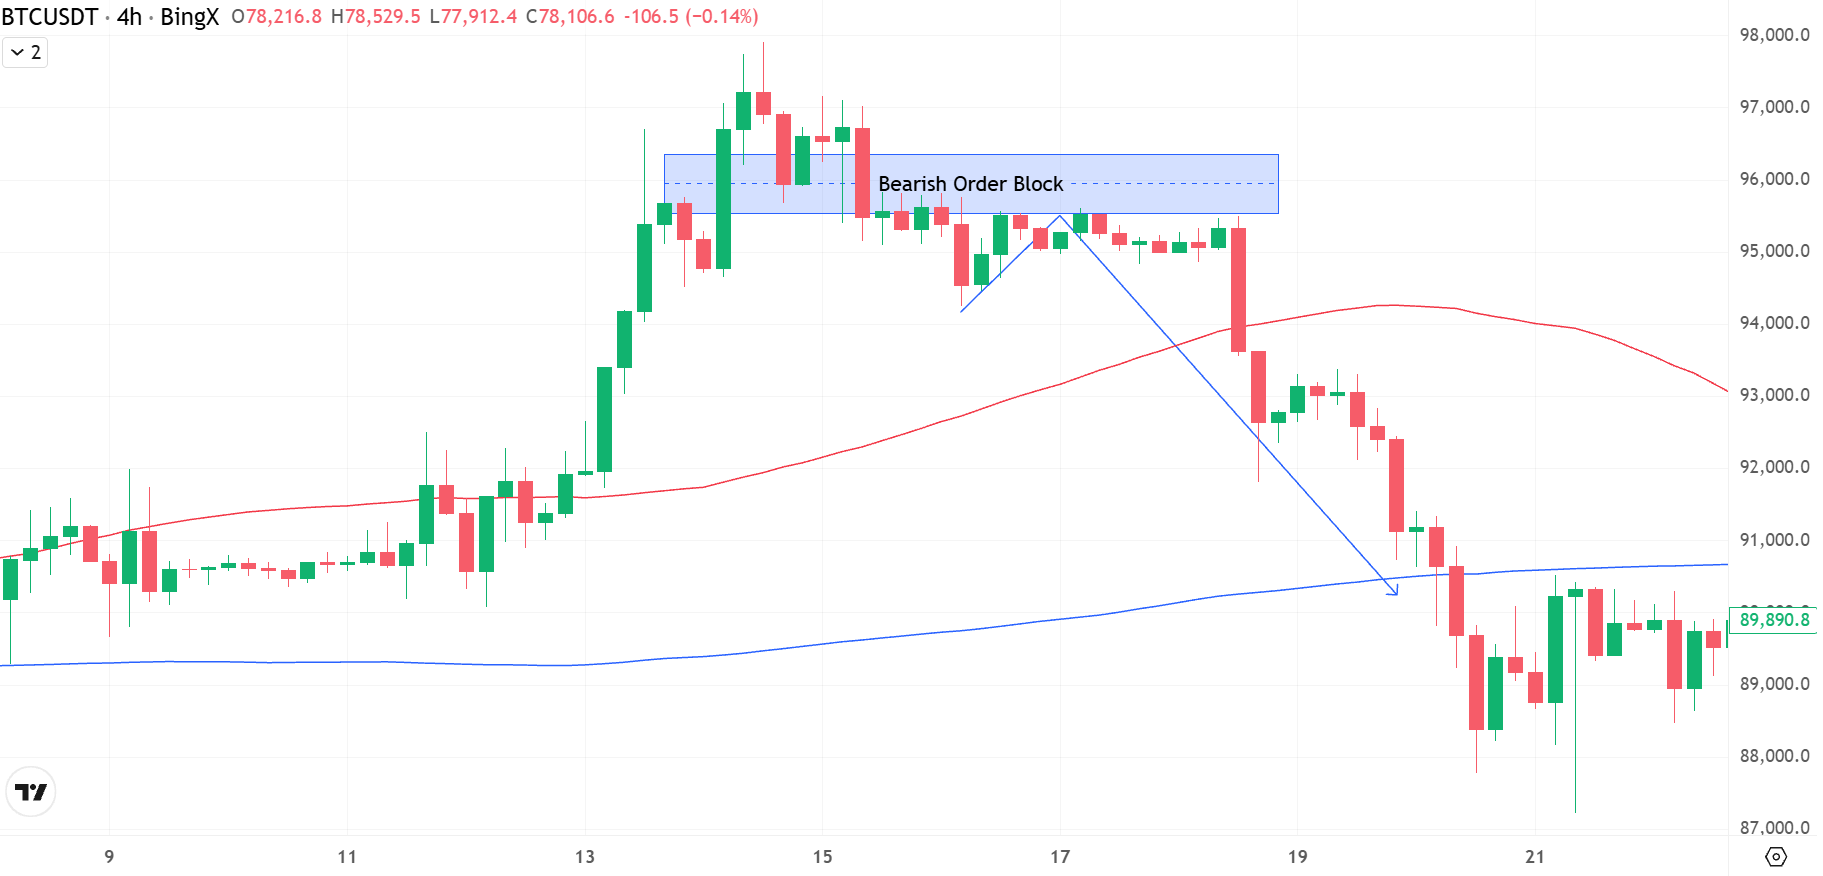
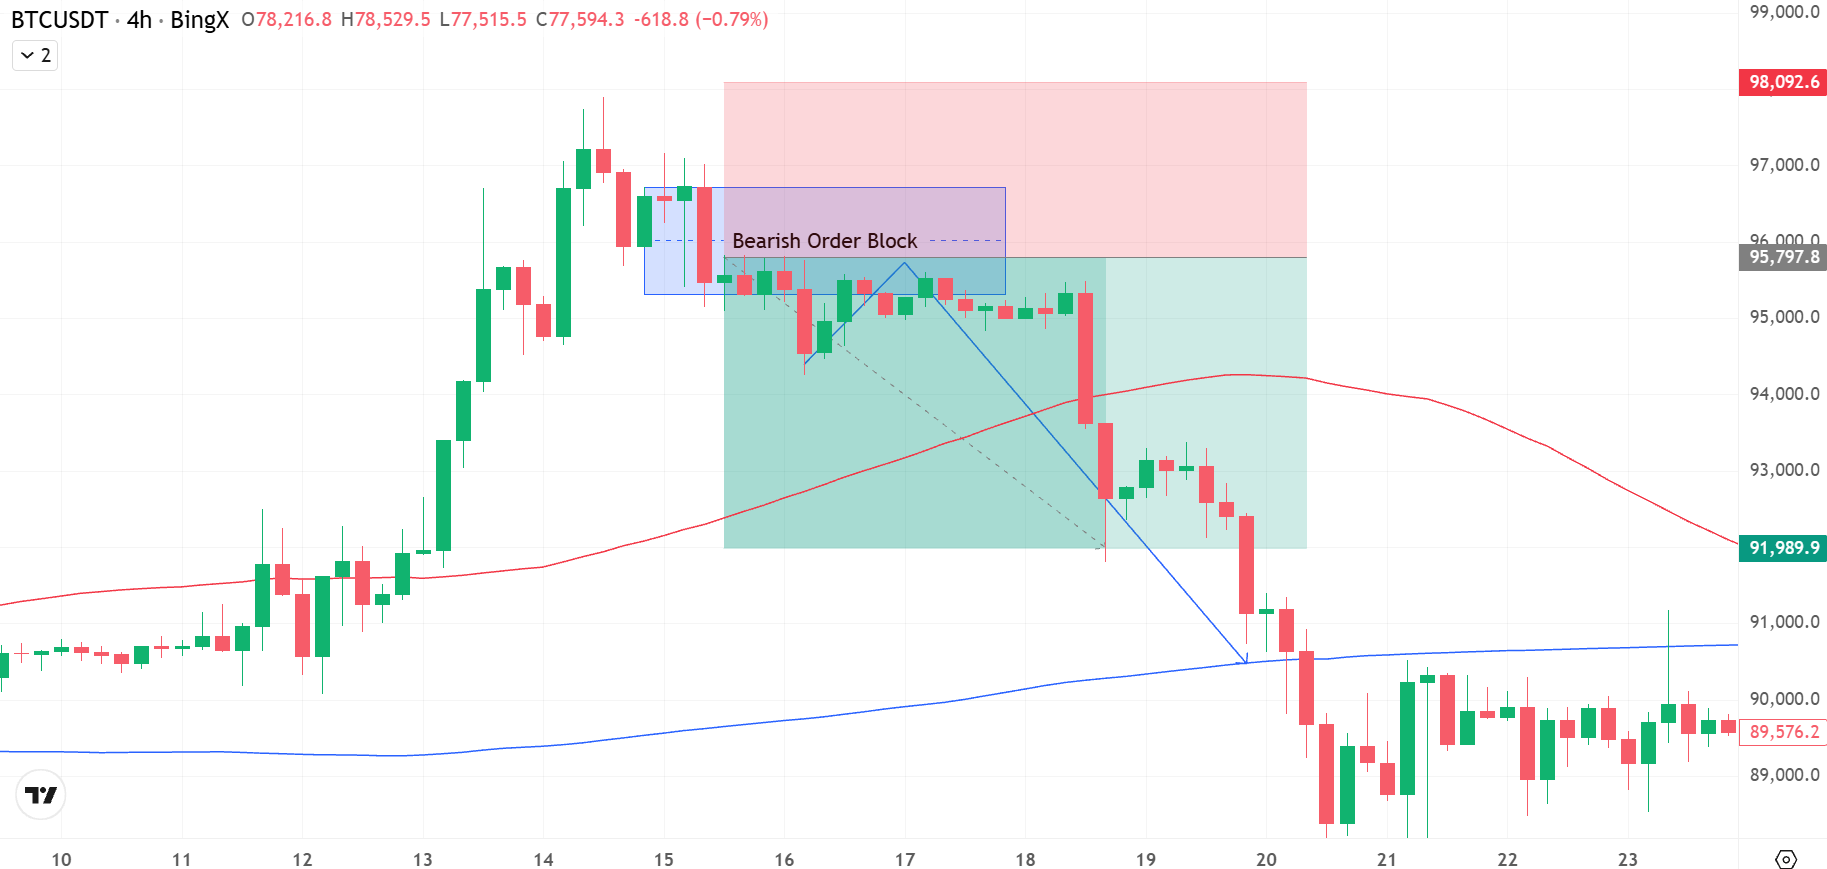
Bearish OB formation on BTC/USDT 4H - Source: BingX
On the 4-hour chart above, Bitcoin printed a clear bearish order block in the $95,500–$96,500 zone, representing the last bullish candle cluster before institutional selling drove price sharply lower. Price rallied back into this supply zone around April 17, offering a textbook re-test entry before rejecting decisively and cascading down toward $88,000. The confluence of the curved moving average turning downward within the same zone reinforced the bearish OB as a high-probability distribution area for smart money.
What Makes a Bearish Order Block Valid?
- Clear uptrend or rally preceding the zone
- Strong impulsive move away, at least 2–3 large bearish candles following the OB
- The OB has not been revisited and closed through (if price already broke through it, it is invalidated)
- Structural significance, forms near a previous swing high or key resistance level
- Higher timeframe alignment, a 4H OB within a daily downtrend carries more weight
Bullish vs. Bearish Order Block: Side-by-Side Comparison
|
Feature |
Bullish Order Block |
Bearish Order Block |
|---|---|---|
|
Position in trend |
Bottom of a downtrend or pullback |
Top of an uptrend or rally |
|
Last candle type |
Last bearish (red) candle before a rally |
Last bullish (green) candle before a drop |
|
Zone function |
Acts as support when revisited |
Acts as resistance when revisited |
|
Trade bias |
Long (buy) when price returns |
Short (sell) when price returns |
|
Stop-loss placement |
Below the low of the OB zone |
Above the high of the OB zone |
|
Invalidated when |
Price closes below the entire zone |
Price closes above the entire zone |
Order Block vs. Breaker Block: Key Differences
This is one of the most important distinctions in Smart Money Concepts trading.
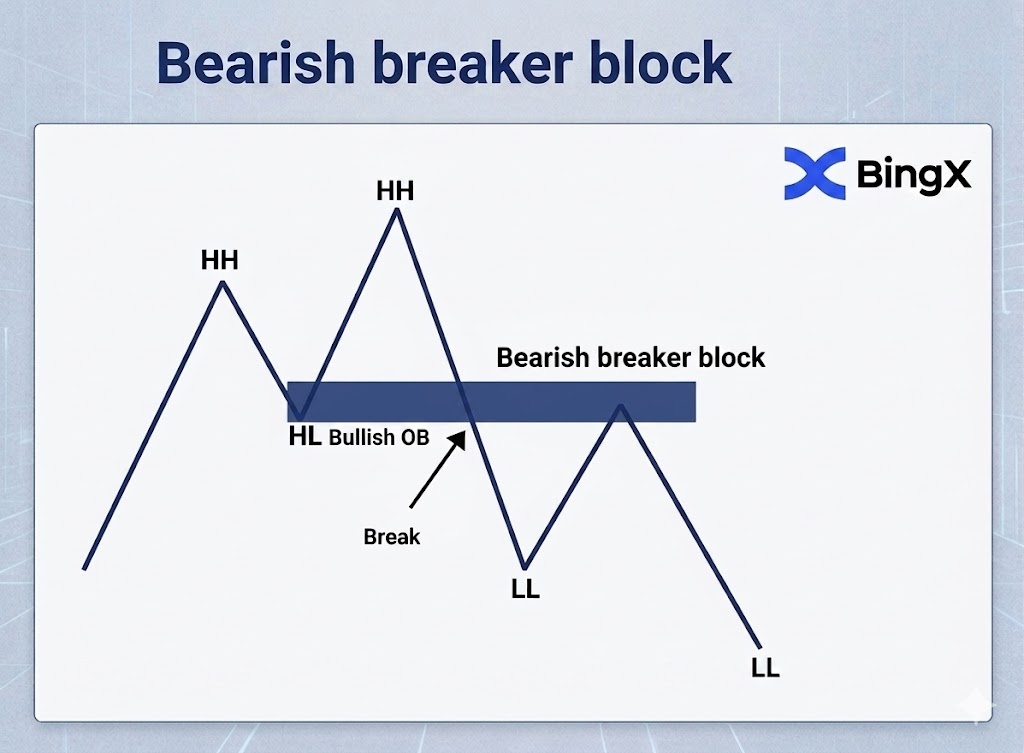
A breaker block is what an order block becomes once price has broken through it and closed beyond the zone. When an order block is violated, meaning price passes through it without respecting it, the zone "flips" its function:
- A bullish order block that gets broken to the downside becomes a bearish breaker block, which now acts as resistance
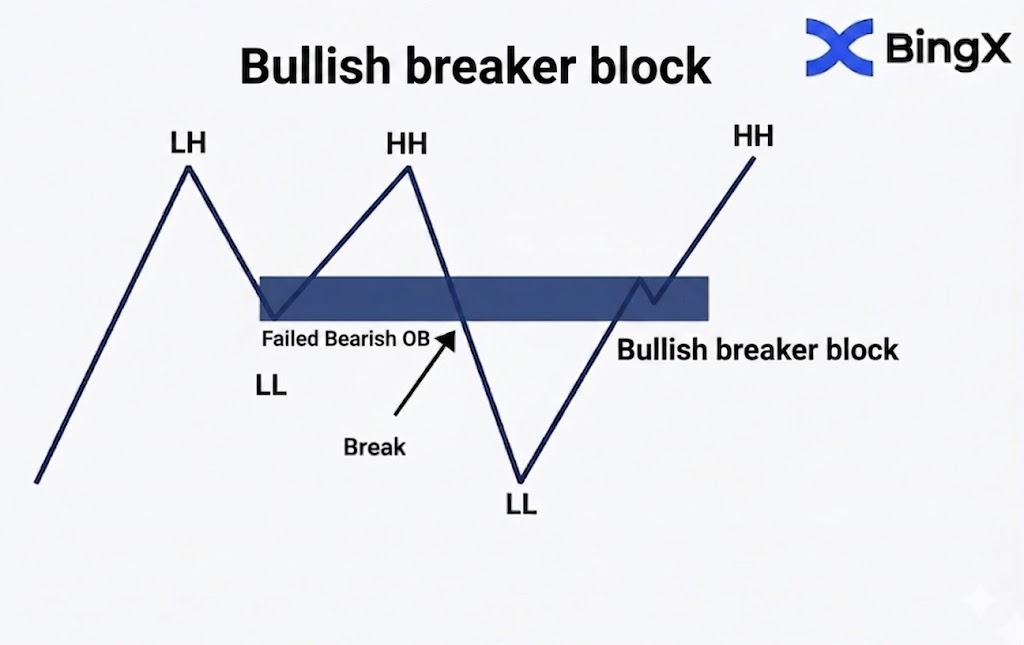
- A bearish order block that gets broken to the upside becomes a bullish breaker block, which now acts as support
|
Feature |
Order Block |
Breaker Block |
|---|---|---|
|
Status |
Unmitigated — price has not closed through it |
Mitigated — price has closed through the original zone |
|
Function |
Acts as support (bullish) or resistance (bearish) |
Function has FLIPPED — was support, now resistance (or vice versa) |
|
Trade entry |
Enter on first or second revisit |
Enter on revisit from the new direction |
|
Reliability |
High on first touch |
Moderate — requires confirmation |
How to Trade Order Blocks on BingX: Step-by-Step Strategy
How to Trade a Bullish Order Block: Long Trade
Setup requirements
- Higher timeframe (Daily or Weekly) in an uptrend or at a significant support area
- A bullish order block identified on 4H or 1H chart
- Price has pulled back into the OB zone
Step 1: Identify the OB zone - Find the last bearish candle before the most recent impulsive rally on your chosen timeframe. Draw a rectangle from its high to its low.
Step 2: Wait for price to return to the zone - Do not enter on the initial move away. Wait for price to pull back into the OB rectangle. The zone should not have been closed through previously.
Step 3: Look for confirmation on a lower timeframe - Drop to a lower timeframe (1H or 15M) and look for:
- A bullish rejection candle (hammer, bullish engulfing, or inverted hammer) inside the OB zone
- RSI showing oversold conditions or bullish divergence
- A break of structure to the upside on the lower timeframe
Step 4: Enter the trade - Place your entry at the top of the bullish OB zone (or on the confirmation candle close on the lower timeframe).
Step 5: Set your stop-loss - Place the stop-loss a few pips/points below the low of the entire OB zone. If price closes below the zone, the OB is invalidated, you want to be out.
Step 6: Set your take-profit - Target the next significant resistance level, swing high, or the origin of the initial impulsive move that created the OB. Aim for a minimum 1:2 risk-to-reward ratio.
Bullish OB trade setup on BTC/USDT with entry, SL, TP - Source: BingX
How to Trade a Bearish Order Block: Short Trade
Setup requirements:
- Higher timeframe (Daily or Weekly) in a downtrend or at a significant resistance area
- A bearish order block identified on 4H or 1H chart
- Price has rallied back up into the OB zone
Step-by-step execution:
Step 1: Identify the OB zone - Find the last bullish candle before the most recent impulsive decline on your chosen timeframe. Draw a rectangle from its high to its low.
Step 2: Wait for price to return to the zone - Do not enter on the initial drop. Wait for price to rally back into the OB rectangle. Confirm it has not already been closed through.
Step 3: Look for confirmation on a lower timeframe: Drop to a lower timeframe (1H or 15M) and look for:
- A bearish rejection candle (shooting star, bearish engulfing, or dark cloud cover) inside the OB zone
- RSI showing overbought conditions (above 70) or bearish divergence
- A break of structure to the downside on the lower timeframe
Step 4: Enter the trade - Place your entry at the bottom of the bearish OB zone (or on the confirmation candle close on the lower timeframe).
Step 5: Set your stop-loss - Place the stop-loss a few pips/points above the high of the entire OB zone. If price closes above the zone, the OB is invalidated.
Step 6: Set your take-profit - Target the next significant support level, swing low, or the origin of the initial impulsive move. Aim for a minimum 1:2 risk-to-reward ratio.
Bearish OB trade setup on BTC/USDT with entry, SL, TP - Source: BingX
How to Combine Order Blocks With Other Indicators
An order block alone gives you a level, but confirmation from other tools significantly improves accuracy.
RSI Confluence
For bullish OBs: RSI reading below or near 30 (oversold) when price returns to the zone = strong confirmation. RSI bullish divergence (price making a lower low while RSI makes a higher low) = even stronger.
BTC/USD Price Chart - Source: BingX
For bearish OBs: RSI reading above 70 (overbought) when price returns to the zone = strong confirmation. RSI bearish divergence (price making a higher high while RSI makes a lower high) = strong reversal signal.
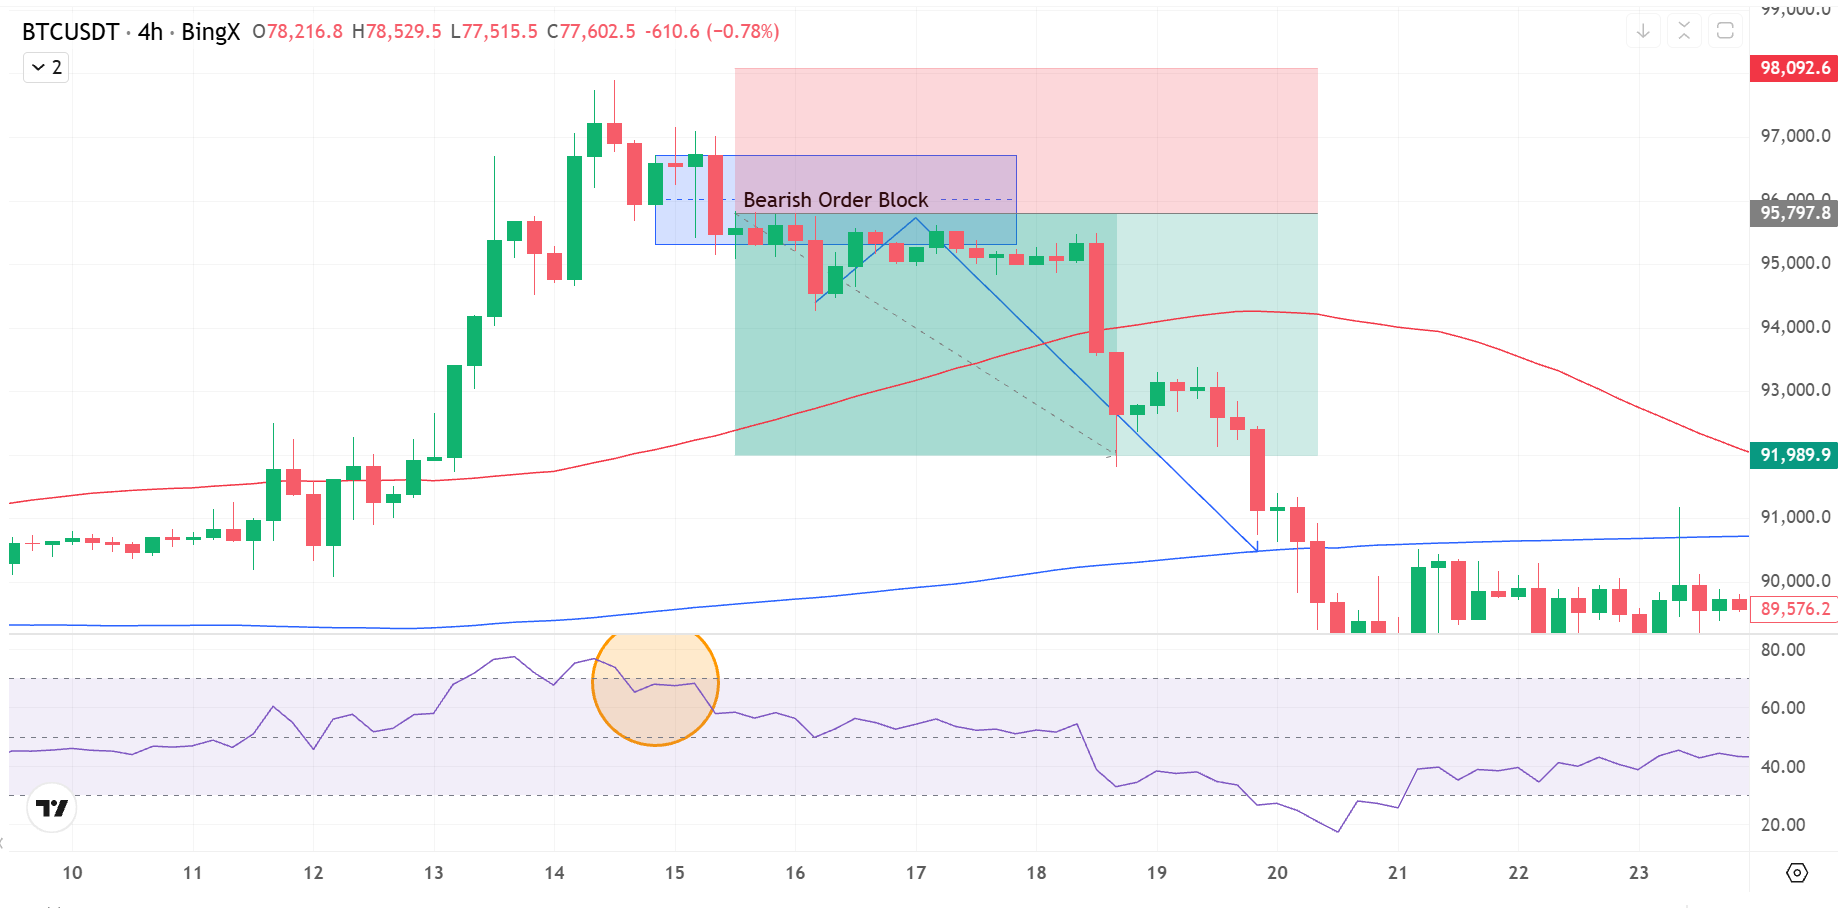
BTC/USD Price Chart - Source: BingX
Volume Analysis
- A bullish OB with high volume on the initial impulsive move away = more institutional conviction = stronger zone
- When price returns to an OB on low volume = weak test, higher probability the zone holds
- A spike in volume as price enters the OB = institutions defending the zone
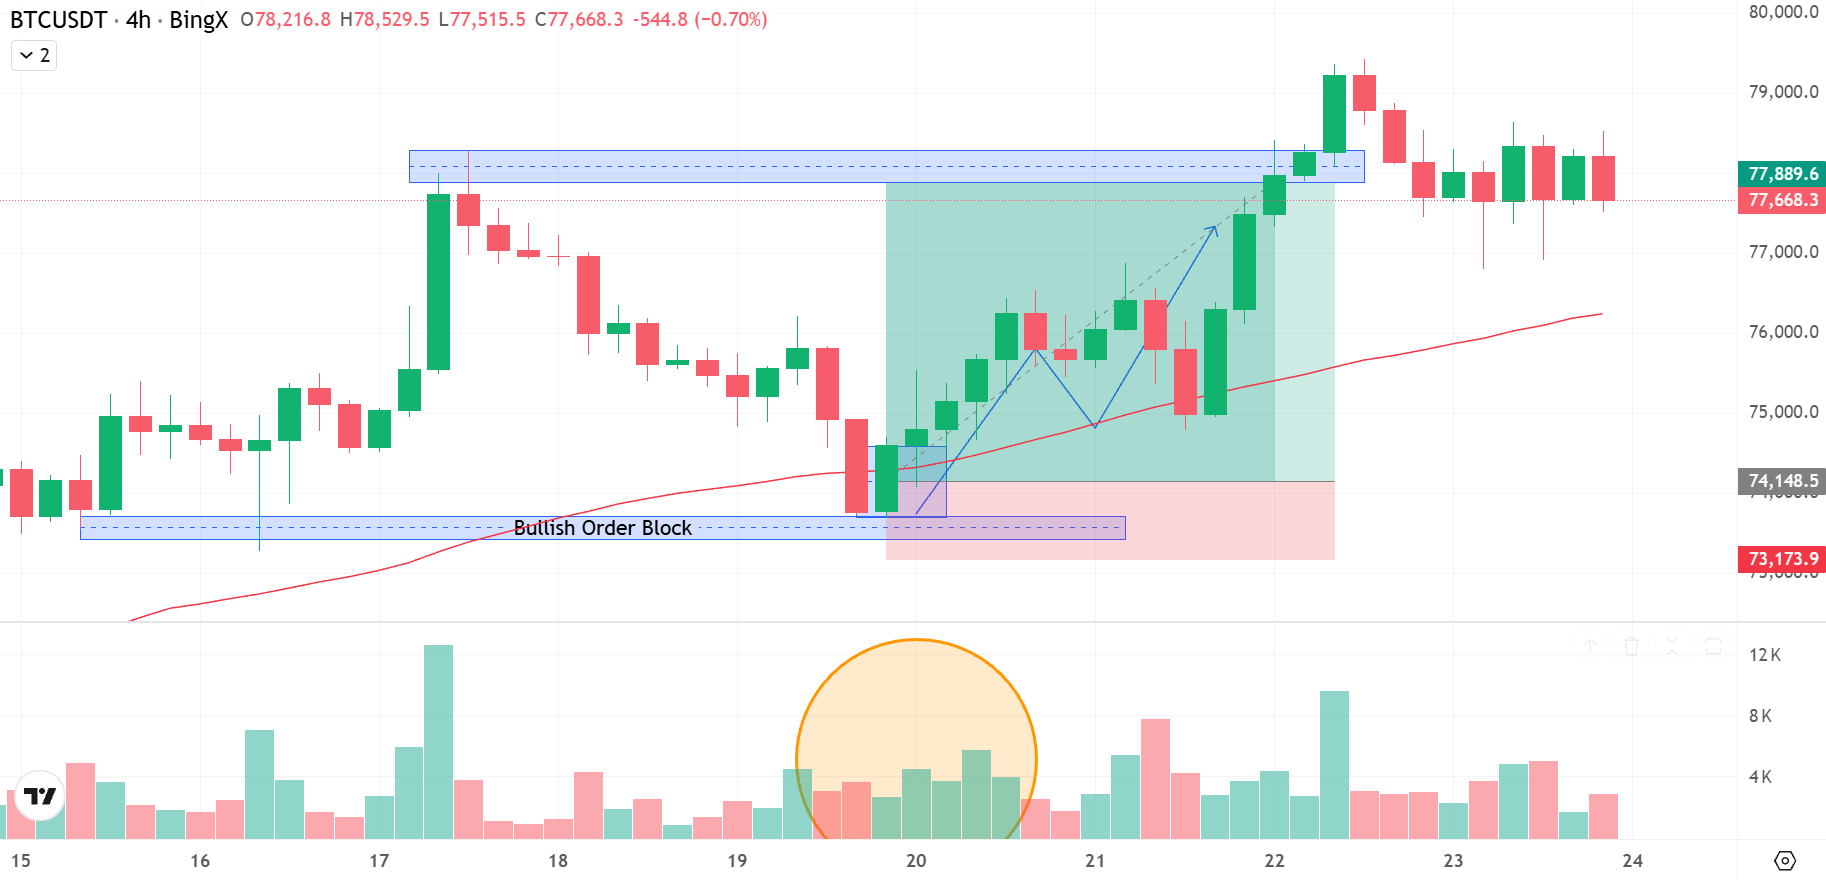
BTC/USD Price Chart - Source: BingX
What Are the Common Mistakes When Trading Order Blocks?
1. Entering at the first touch without confirmation: The most frequent error. An order block is a zone, not a guaranteed entry. Price can slice through it without reacting. Always wait for a confirmation candle or a lower-timeframe break of structure before entering.
2. Using invalidated order blocks: If price has already closed through an OB zone, the block is no longer valid as an OB. It may have become a breaker block, but it no longer functions as the original support or resistance. Mark it as mitigated and look for fresh zones.
3. Trading OBs against the higher timeframe trend: A bullish OB in a daily downtrend is fighting the trend. The probability is lower. Always align your OB entries with the dominant trend on at least one higher timeframe.
4. Drawing the zone incorrectly: The OB zone should cover the LAST candle before the impulsive move — not a cluster of candles, not the entire consolidation area. Precision matters: a wide, vague zone provides imprecise entries and stop-losses.
5. Setting the stop-loss inside the zone: Your stop-loss should be below the entire OB zone (for bullish) or above the entire zone (for bearish). Placing it inside the zone means a single wick will stop you out before the setup plays out.
6. Ignoring market context: Order blocks perform best in trending markets with clear structure. In choppy, sideways markets, OB zones break down frequently. Check the broader context before committing to an OB trade.
Order Block Checklist: Before Every Trade
Before entering any order block trade, confirm these:
- Higher timeframe trend identified (Daily or Weekly)
- OB zone is on 4H or 1H chart, aligned with higher timeframe
- OB is the LAST candle before the impulsive move, and not the whole consolidation
- OB has not been previously mitigated (closed through)
- Price is currently returning to the OB zone
- Confirmation candle exists on lower timeframe entry
- RSI confirms: oversold for bullish OB, overbought for bearish OB
- Stop-loss placed below (bullish) or above (bearish) the entire zone
- Take-profit set at next structure level, minimum 1:2 R:R
- Position sized within 1–2% account risk per trade
How to Apply Order Blocks on BingX
Order blocks can be applied to both BingX Spot and Perpetual Futures markets:
On BingX Spot: Enter long positions when price returns to a bullish order block on your preferred timeframe. Use BingX's built-in TradingView charts to draw your OB rectangles directly on the chart. Set take-profit and stop-loss orders in the order panel.
On BingX Perpetual Futures: Order blocks are particularly useful in futures trading where you can trade both long (bullish OB) and short (bearish OB) directions. Apply TP/SL orders directly when placing your trade. Use the 4H and Daily charts as your primary OB identification timeframes.
BingX charting tips for OB trading:
- Open your BTC/USDT chart on BingX
- Switch to the TradingView advanced chart view
- Use the Rectangle tool to draw OB zones
- Use the RSI indicator (14 period) in the lower panel for confirmation
- Use volume bars to validate the strength of the initial impulsive move
Conclusion
Order blocks are one of the most precise tools available to crypto traders who want to trade in alignment with institutional activity rather than against it. Unlike generic support and resistance levels, order blocks give you a specific, logic-backed reason for why a zone should hold. the remaining unfilled orders from large players who created the impulsive move in the first place.
The key to using them effectively: identify the last candle before a strong impulsive move, wait for price to return to that zone, get confirmation from a lower timeframe or indicator, and enter with a clearly defined stop-loss below (or above) the entire zone. Keep your higher timeframe trend in view at all times; an order block with the trend is significantly more reliable than one against it.
Practice identifying OBs on BingX's BTC/USDT 4H chart before trading them live. Mark up historical charts, track how often price respects the zones, and build your eye for the setup before committing real capital.
Related Articles
- War & Crypto: How to Profit from Liquidity Gaps & Fair Value Gaps (FVG) During Global Uncertainty
- Crypto Chart Patterns: The Complete Guide for Traders
- Crypto Candlestick Patterns: A Complete Guide
- How to Use RSI in Crypto Trading
- How to Use MACD in Crypto Trading
- Risk Management in Crypto Trading: 7 Rules Every Trader Must Know
FAQs on Order Block in Crypto Trading
1. What is an order block in trading?
An order block is a price zone on a chart where institutional buying or selling activity occurred just before a sharp, impulsive price move. It is identified as the last bearish candle before a strong rally (bullish order block) or the last bullish candle before a strong decline (bearish order block). These zones tend to act as support or resistance when price returns to them, because large market participants often have remaining orders sitting at those levels.
2. What is a bullish order block?
A bullish order block is the last bearish (red) candle immediately before a strong impulsive move upward. It represents a zone of institutional accumulation, large buyers building their positions before launching price higher. When price returns to this zone, it often acts as support and provides a high-probability long entry opportunity.
3. What is a bearish order block?
A bearish order block is the last bullish (green) candle immediately before a strong impulsive move downward. It represents a zone of institutional distribution, large sellers placing their positions before pushing price lower. When price returns to this zone, it often acts as resistance and provides a high-probability short entry opportunity.
4. What is the difference between an order block and a breaker block?
An order block is an unmitigated zone, price has not yet closed through it. A breaker block is what an order block becomes after price has broken through it. Once the zone is violated (price closes beyond it), the zone's function flips: a former bullish order block (support) becomes a bearish breaker block (resistance), and vice versa.
5. How do I identify an order block on a chart?
Find a strong impulsive move (a sharp rally or sharp drop). Look left and identify the last candle in the opposing direction immediately before the move begins. Draw a rectangle from the high to the low of that candle. That rectangle is the order block zone. It becomes active when price returns to it in the future.
6. What timeframe is best for order block trading?
The 4-hour and Daily timeframes produce the most reliable order blocks in crypto trading. Most traders identify the OB zone on the 4H chart and then drop to the 1H or 15M chart for a precise entry trigger. Lower timeframes (5M, 15M) can have order blocks but they are less reliable and more prone to false reactions.
7. How do I trade an order block?
Wait for price to return to the OB zone after the initial impulsive move. Look for a confirmation signal — a rejection candle on the lower timeframe, an RSI oversold reading (for bullish OBs), or a break of structure in the entry direction. Place your entry at the near edge of the OB zone, your stop-loss beyond the far edge, and your take-profit at the next swing high/low. Target a minimum 1:2 risk-to-reward ratio.
8. Are order blocks the same as supply and demand zones?
Order blocks and supply/demand zones are closely related concepts but differ slightly in their identification method. Supply and demand zones are typically defined by the entire consolidation area before a move. Order blocks are more specific, defined by the last single candle (or last few candles) before the impulsive move, making them more precise for entry timing. Many SMC (Smart Money Concepts) traders use the terms interchangeably, though strict ICT methodology defines them differently.
9. What are Smart Money Concepts (SMC)?
Smart Money Concepts is a trading methodology developed within the ICT (Inner Circle Trader) community that focuses on identifying the footprints of institutional traders ("smart money") in the market. Order blocks are one of the core concepts within SMC, alongside liquidity sweeps, fair value gaps, breaker blocks, and market structure analysis. The goal is to trade in alignment with institutional order flow rather than against it.