
Crypto markets can be unpredictable, often moving in sharp waves that confuse even experienced traders. To cut through this noise, many turn to technical analysis, a method that helps identify trends using historical price data. One of the most widely used tools in this process is the moving average.
A moving average is simply a line that tracks the average price of cryptocurrency over a selected timeframe. By smoothing out short-term volatility, it helps traders discern the overall direction of the market, whether prices are generally trending upward or downward.
On BingX, moving averages are integrated into the spot and futures trading interface and utilised by millions of traders to gauge market momentum. Whether you're trading Bitcoin, Ethereum, or other digital assets, this indicator can help you decide when to buy or sell with greater confidence.
In this guide, we’ll break down how moving averages work, the difference between simple and exponential types, and how you can apply them directly within the BingX platform using real BTC/USDT examples.
What is a Moving Average?
In crypto trading, a moving average is a simple tool that helps you track the average price of a coin, like Bitcoin or Ethereum, over a specific time period, such as the past 20 days, 50 days, or 200 days. The chosen timeframe affects how sensitive the moving average is to recent price changes. Instead of reacting to every price swing, this indicator shows a smoother line that helps you understand the overall trend.
It works by taking past price data, usually the closing prices, and calculating the average over a set number of days. For example, if you're using a 5-day simple moving average (SMA), you add up the last five daily closing prices and divide by five. As new prices come in, the old data drops off and the average updates, creating a “moving” effect on the chart.
Here’s why crypto traders on platforms like BingX use moving averages:
• To filter out short-term price noise and focus on the broader trend
• To identify when a coin might be gaining or losing momentum
• To spot potential buy or sell signals based on trend direction
Whether you're looking at BTC/USDT, ETH/USDT, or any other crypto pair, moving averages help you step back from volatile price action and see the bigger picture. They're a foundation for many crypto trading strategies and are often used alongside other tools to improve timing and decision-making.
How to Choose the Right Type of Moving Average
Crypto traders use several types of moving averages to read the market, but not all are created equal. Each method calculates the average price differently, which can influence how quickly a trader spots changes in momentum.
On BingX, the most common types you’ll encounter are the Simple Moving Average (SMA), Exponential Moving Average (EMA), and Weighted Moving Average (WMA).
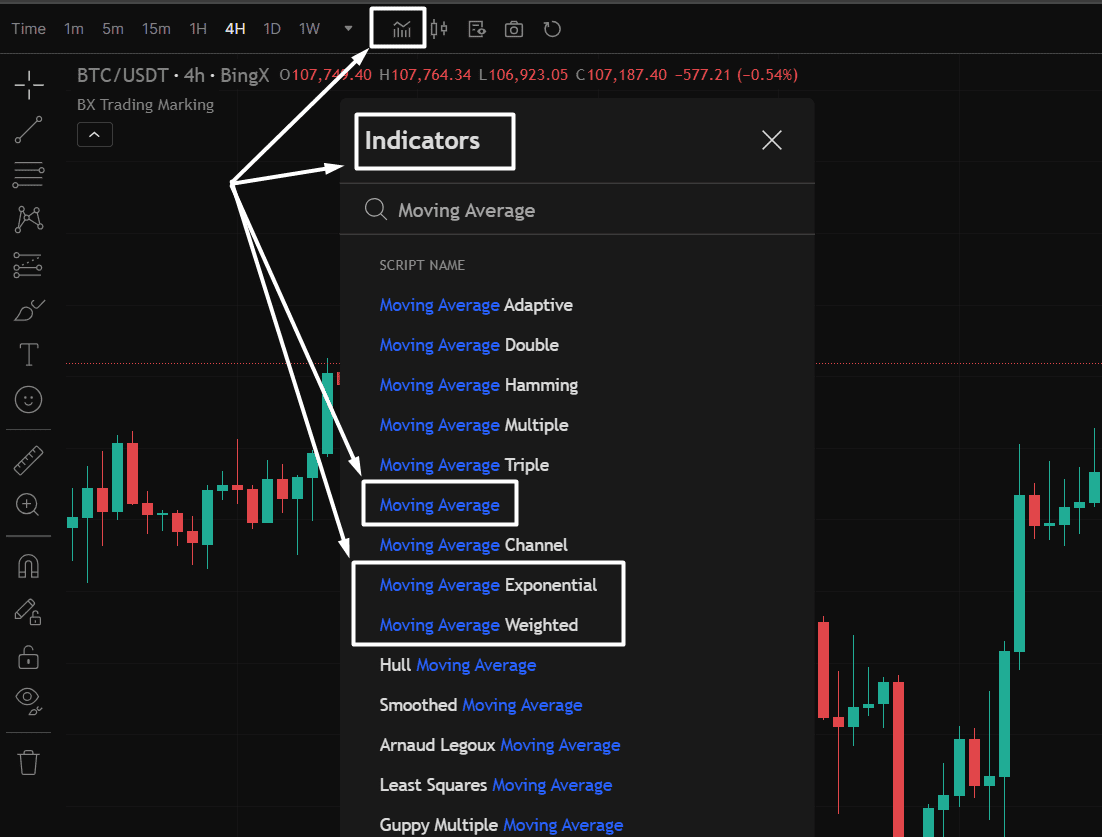
Source: BTC/USDT Trading Chart on BingX
Understanding how each works helps you choose the right one for your strategy.
1. Simple Moving Average (SMA)
The Simple Moving Average is the most straightforward type. It adds together the closing prices over a chosen period and divides the total by the number of days.
For example, a 10-day SMA of BTC/USDT:
1. Add up the last 10 closing prices of Bitcoin
2. Divide the sum by 10
3. That result becomes the current SMA point on the chart
Traders use SMA to gauge the overall direction of the market. It’s less sensitive to short-term volatility, making it a good option when you want a broad view of price action.
Common SMA timeframes include:
• 10-day or 20-day for short-term trends
• 50-day for mid-term analysis
• 200-day for long-term market direction
The longer the period, the smoother the line, but the slower it reacts to new price movements.
2. Exponential Moving Average (EMA)
The Exponential Moving Average gives more weight to recent data, making it more responsive to market changes. While the exact weighting depends on the time period chosen, the EMA emphasises the most recent prices, typically the last few candles (or days, hours, or minutes, depending on the chart). For example:
• In a 10-day EMA, prices from the past 3–5 days carry more influence than older ones.
• This makes the EMA faster to react to price spikes or trend shifts.
Traders often use:
• 12-day and 26-day EMAs for short-term momentum (especially in crypto day trading)
• 50-day EMA for medium-term trend confirmation
• 200-day EMA to spot long-term reversals or support/resistance zones
It uses a formula:
EMA = (Price – Previous EMA) × Multiplier + Previous EMA
This method focuses more on:
• EMA yesterday: the previous day’s EMA value
• Most recent price: today’s closing price
• More influence: newer prices have stronger impact than older ones
Because it reacts faster, the EMA is preferred by active traders on BingX who want early signals during fast-moving markets like BTC or ETH.
3. Weighted Moving Average (WMA)
The WMA is similar to EMA but assigns specific weights to each day. The most recent day has the highest weight, and each day before it has progressively less.
• Best used when you want to sharpen your focus on the latest price movement
• Helpful for short-term strategies during high volatility
While less common than SMA or EMA, WMA gives crypto traders even more control over how new data shapes the average.
How to Use Moving Averages to Trade Crypto Confidently
Moving averages are simple yet powerful tools that help crypto smooth out price action, reveal trends, and highlight key support and resistance levels.
A moving average tracks the average price of a crypto asset over a specific period, like 50 or 200 candles, making it easier to identify whether the market is trending up, down, or consolidating. On platforms like BingX, moving averages can be applied across multiple time frames and trading pairs to improve decision-making.
Let’s break down how you can use them effectively:
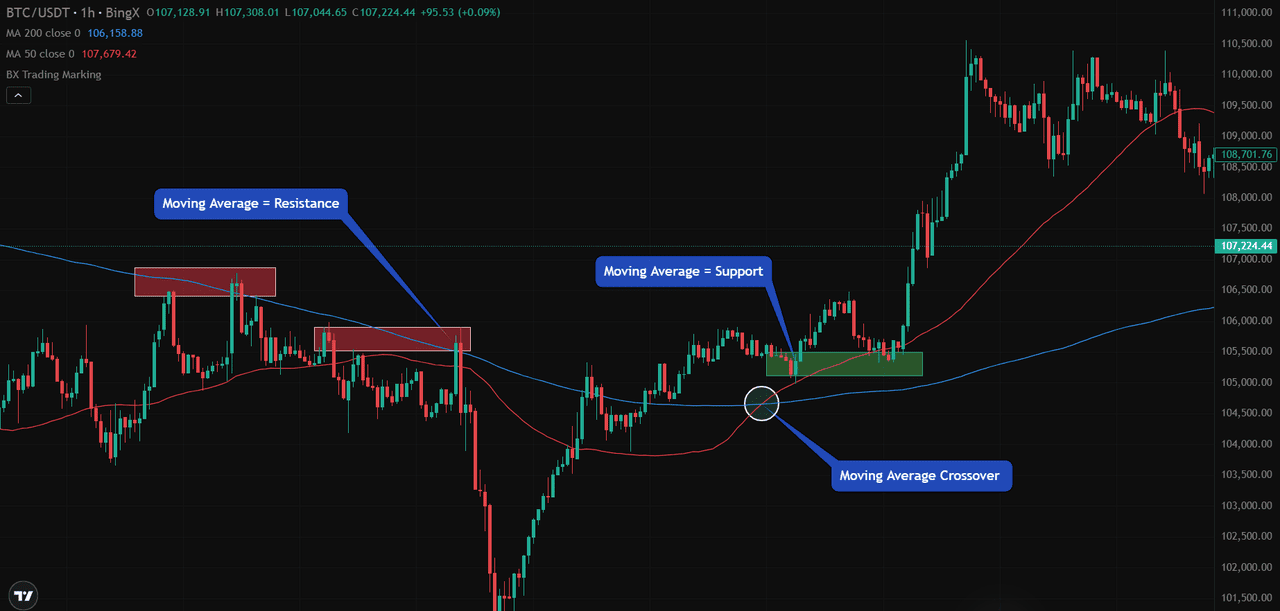
On the BTC/USDT chart above, you can see how the 50-period moving average (red line) and 200-period moving average (blue line) acted at key moments:
• Resistance: In earlier phases, Bitcoin struggled to break above the 200 MA. That blue line acted as a resistance level, pushing price lower multiple times.
• Support: Later, the price bounced off the same 200 MA, which flipped to become support, confirming a shift in trend.
• Crossover: The moment the 50 MA crossed above the 200 MA marked a bullish signal. This is known as a moving average crossover and often indicates growing buying momentum.
1. Identify Trend Direction and Momentum
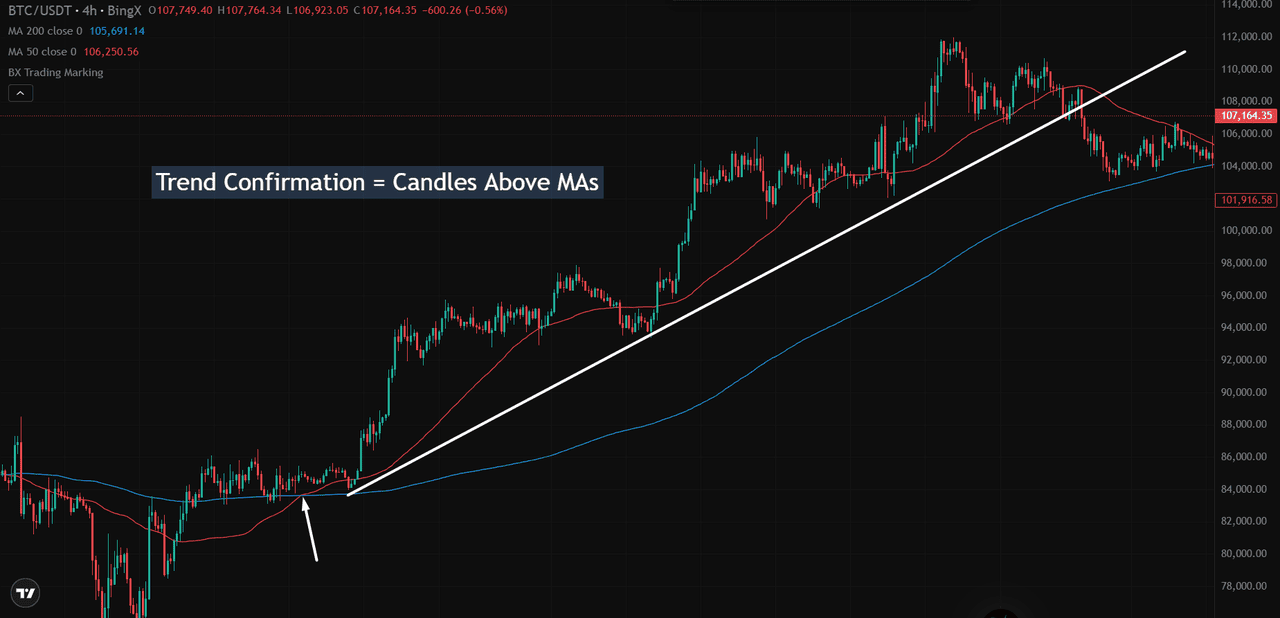
Source: BTC/USDT Trading Chart on BingX
A rising moving average suggests an uptrend, while a falling one indicates bearish momentum. The 200-period MA is especially useful as a long-term trend filter. If the price stays above it, bulls are in control. Below it? Sellers dominate.
2. Use Moving Averages as Dynamic Support and Resistance
Source: BTC/USDT Trading Chart on BingX
MAs can act like invisible support or resistance zones. On the BTC/USDT chart above, Bitcoin initially struggled to break above the 200 MA (blue), which acted as resistance. Later, the same MA became support, an early signal of trend reversal.
3. Look for Moving Average Crossovers
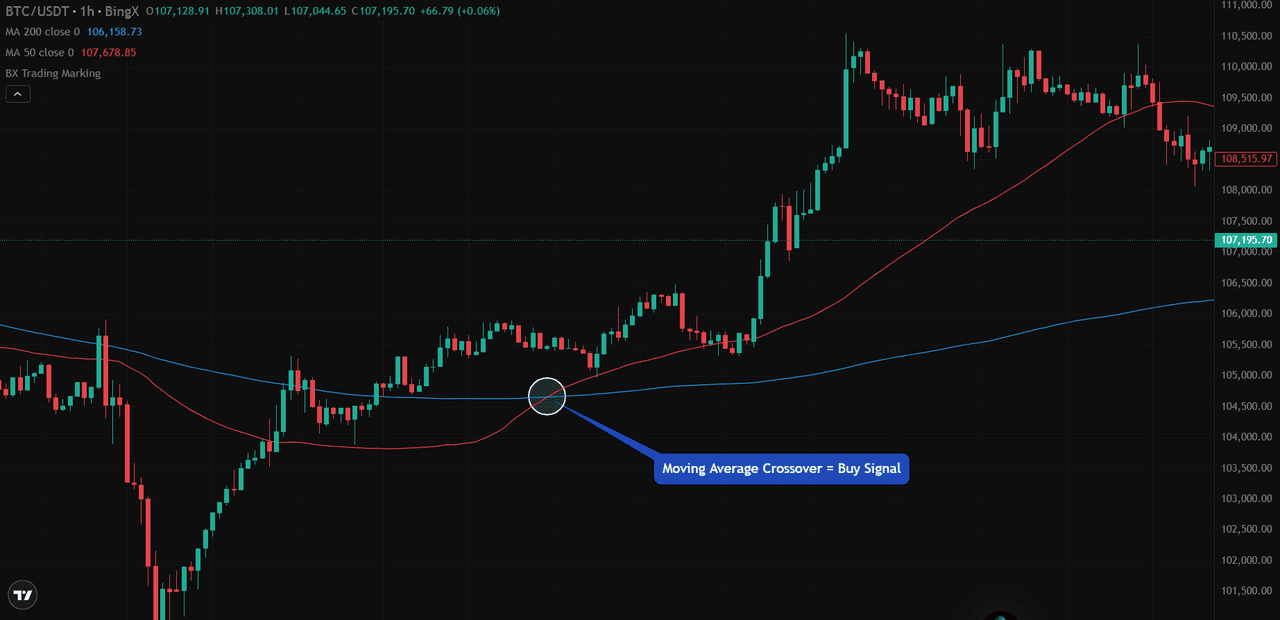
Source: BTC/USDT Trading Chart on BingX
One of the most popular strategies is the crossover method:
• A bullish crossover, also known as a Golden Cross, happens when a short-term MA (like the 50 MA) crosses above a long-term MA (like the 200 MA). This can signal the start of a rally.
• A bearish crossover, also known as a Death Cross, is when the short-term MA (like the 50 MA) crosses below the long-term MA (like the 200 MA), often hinting at a price decline.
Crossovers help reduce guesswork and can act as clean buy or sell signals based on market structure.
4. Adapt to Any Trading Style
Moving averages are flexible tools suited for all types of traders:
• Day traders use short MAs (5–15 min charts) for quick setups.
• Swing traders prefer daily charts with 20, 50, or 100 MAs.
• Long-term holders monitor weekly or monthly trends using the 100 or 200 MA.
What Are the Limitations of Moving Averages?
While moving averages are valuable tools for spotting trends in crypto trading, they do have limitations.
The biggest drawback is that they are lagging indicators. Since they’re based on past price data, they react slowly to sudden market changes and don’t always reflect what’s happening in real time. This can lead to late entries or exits, especially in fast-moving markets like Bitcoin.
Moving averages also tend to struggle in sideways or choppy markets, where frequent crossovers can produce false signals. Traders might get caught in a whipsaw effect - buying high and selling low without clear direction.
That’s why moving averages work best when paired with other tools like Relative Strength Index (RSI) or Moving Average Convergence Divergence (MACD). Think of them as part of a broader strategy, not a signal to trade on their own.
Summary and Final Thoughts
Moving averages are essential tools in crypto trading, helping technical traders simplify market data and focus on the overall trend. Whether it’s a Simple Moving Average (SMA) or an Exponential Moving Average (EMA), both offer valuable insight into market direction, especially during volatile price swings.
By testing different periods and combining moving averages with other indicators, such as the RSI, traders can develop more reliable trading strategies. While no single indicator guarantees results, moving averages provide structure, reduce emotional decisions, and form the backbone of many successful crypto strategies, especially when trading on a platform like BingX.
Related Reading
FAQs on Moving Averages
1. What is a moving average in crypto trading?
A moving average is a tool that smooths out past price data to show the average price of cryptocurrency over a set period. It helps traders identify the overall market trend and make informed decisions.
2. Which moving average is better for crypto, SMA or EMA?
Both are useful. SMA gives equal weight to all data points, while EMA reacts faster to recent price changes. EMA is often preferred for short-term trading, while SMA is better for long-term analysis.
3. How can I use moving averages on BingX?
Go to any crypto chart on BingX, click the "Indicators" tab, and select SMA, EMA, or WMA. You can adjust the time period and apply multiple averages to identify crossovers or support/resistance zones.
4. What time frame should I use for moving averages in crypto?
The right moving average depends on your strategy:
• Day traders often use 9, 20, or 50-period EMAs on 5–15 minute charts
• Swing traders prefer 50 or 100-period MAs on daily charts
• Investors focus on 100 or 200-period MAs on weekly charts
5. Can moving averages predict future crypto prices?
No, moving averages are lagging indicators. They reflect past price trends, not future moves. However, they help confirm direction and generate buy/sell signals when combined with other tools, such as the Relative Strength Index (RSI) or Moving Average Convergence Divergence (MACD).