



ExxonMobil (XOM) is an integrated energy company spanning upstream oil and gas production, refining, fuels, chemicals and specialty products. Its scale across the Permian Basin, Guyana and liquefied natural gas supports production growth, while refineries and chemical plants create additional earnings streams. That integration can cushion individual segment weakness, though the stock remains sensitive to commodity prices, refining margins and major-project execution.
ExxonMobil Q2 2026 demonstrated both sides of that model. Adjusted earnings rose 67% sequentially to $14.7 billion and free cash flow reached $17.2 billion, while production held near 4.5 million oil-equivalent barrels per day. Adjusted EPS of $3.52 still missed the $3.60 consensus, showing that exceptional oil prices and refining conditions do not guarantee a clean expectations beat.
The XOM stock forecast for 2026 now centers on two competing views:
- The advantaged-growth case: record Permian output, Guyana expansion, cost savings and integrated margins extend cash-flow growth.
- The normalization case: lower oil prices, refining volatility and Middle East disruption reduce earnings before long-term projects add enough value.
This guide breaks down the XOM stock forecast, 2026 price scenarios, key risks and analyst outlooks, drawing on ExxonMobil's July 31 Q2 2026 earnings release, quarterly filing and market data through September 10, plus how to trade XOM stock futures on BingX TradFi with USDT collateral.
Top 5 Things for ExxonMobil Investors to Know in September 2026
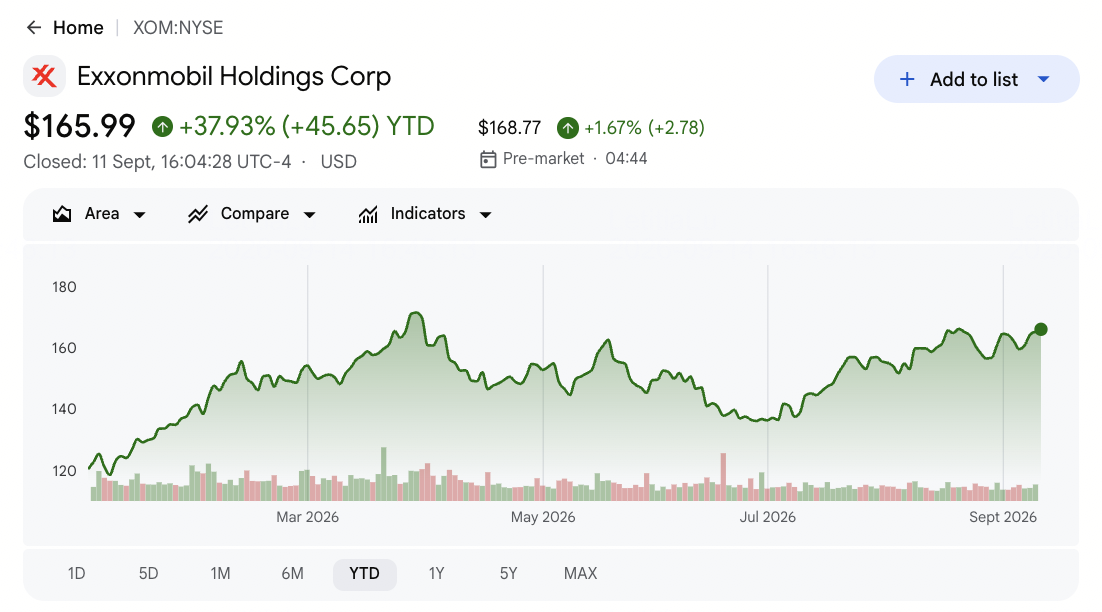
- XOM closed at $165.23 after gaining about 30% in 2026: The rise reflects higher oil prices, stronger refining conditions and growth from advantaged assets. Shares remain below the $185 selected Street high, though further upside depends on cash flow keeping pace with the valuation.
- Adjusted Q2 earnings reached $14.7 billion, up 67% sequentially: Earnings more than doubled from the prior year as higher oil prices and refining margins strengthened the portfolio. Adjusted EPS of $3.52 still missed the $3.60 consensus by $0.08.
- Permian production reached a record 1.8 million barrels per day: The basin helped offset Middle East shutdowns as total production held near 4.5 million boe/d. Exxon targets 2.5 million boe/d from the Permian by 2030.
- Free cash flow of $17.2 billion funded $9.4 billion of shareholder returns: Exxon paid $4.3 billion in dividends and repurchased $5.1 billion of stock in Q2. It also reduced net debt by $7 billion, strengthening both per-share returns and the balance sheet.
- The 2030 plan targets 5.5 million boe/d and $35 billion of cash-flow growth: Exxon expects advantaged assets to reach 65% of volumes and targets $25 billion of earnings growth from 2024. Delivering that roadmap still requires disciplined annual spending of $28 billion to $33 billion.
What Is ExxonMobil (XOM)?
ExxonMobil is one of the world's largest publicly traded integrated energy companies. Its Upstream business explores for and produces oil and natural gas, while Energy Products refines crude and markets fuels, lubricants and feedstocks. Chemical Products and Specialty Products convert hydrocarbons into materials used across packaging, transportation, construction and industrial applications. Earnings therefore depend on production volumes, realized prices, refining utilization, product margins, operating costs and the capital required to develop long-lived resources.
Its long-term strategy concentrates investment in lower-cost assets and proprietary operating advantages. The Pioneer acquisition expanded Exxon's Permian position, while offshore Guyana is developed with partners through a sequence of floating production projects. LNG projects broaden its gas portfolio and Product Solutions investments target higher-value fuels, chemicals and materials. The 2030 plan targets 5.5 million boe/d of production, $25 billion of earnings growth and $35 billion of cash-flow growth from 2024, alongside $20 billion of structural cost reductions.
Read More: Top Energy Stocks and ETFs to Buy in 2026: The AI Power Crunch Meets Geopolitical Volatility
ExxonMobil (XOM) Q2 2026 Earnings Overview: $14.7 Billion Profit Meets an EPS Miss
ExxonMobil reported Q2 revenue of $116.02 billion versus $109.9 billion expected, adjusted EPS of $3.52 versus $3.60 expected and adjusted earnings of $14.7 billion, up 67% sequentially. Production held near 4.5 million boe/d as Permian output reached 1.8 million boe/d. Free cash flow of $17.2 billion funded $9.4 billion of shareholder returns, although Middle East disruption constrained production.
Read More: Exxon Mobil (XOM) Q2 2026 Earnings Overview: $3.52 Adjusted EPS Miss Triggers a 0.97% Selloff
|
Financial Metric |
Guidance / Consensus |
Reported / Actual |
Surprise |
|
Q2 revenue |
$109.9B consensus |
$116.02B |
Beat. About $6.1B above consensus and up 42.3% YoY. |
|
Q2 adjusted EPS |
$3.60 consensus |
$3.52 |
Missed. $0.08 below consensus despite more than doubling YoY. |
|
Q2 adjusted earnings |
Q1 2026 |
$14.7B |
Expanded. Up 67% sequentially and highest in four years. |
|
Q2 free cash flow |
Street expectations |
$17.2B |
Beat. Strong cash conversion supported debt reduction and returns. |
|
Q2 production |
Prior operating level |
4.5 MMboe/d |
Resilient. Permian output offset part of Middle East disruption. |
|
Q2 Permian production |
Prior year |
1.8 MMboe/d |
Record. Scale and Pioneer integration supported advantaged growth. |
|
Q2 upstream earnings |
Q1 2026 |
$9.2B |
Improved. Higher oil prices lifted upstream profitability. |
|
Q2 refining earnings |
Q1 2026 |
$4.1B |
Improved. Stronger margins offset elevated maintenance. |
|
Dividends and buybacks |
$20B annual buyback plan |
$9.4B |
Returned. Included $4.3B dividends and $5.1B repurchases. |
|
Net debt reduction |
Q1 2026 |
$7.0B |
Improved. Commodity cash flow strengthened the balance sheet. |
- Revenue of $116.02 billion beat consensus by about $6.1 billion: Sales rose 42.3% from $81.51 billion a year earlier as oil prices and refining conditions improved. The beat showed strong revenue sensitivity, though segment execution still determines how much reaches earnings.
- Adjusted EPS of $3.52 missed consensus by $0.08: Earnings still more than doubled from $1.64 a year earlier and reached $14.7 billion. The narrow miss kept attention on earnings quality despite the strong headline growth.
- Permian production reached 1.8 million barrels per day: Record output helped total production hold near 4.5 million boe/d despite Middle East shutdowns. Exxon still needs progress toward its 2.5 million boe/d 2030 target.
- Upstream and refining earnings reached $9.2 billion and $4.1 billion: Higher crude prices lifted production profits, while stronger margins improved refining. Elevated maintenance still limited the quarter from fully meeting expectations.
- Free cash flow of $17.2 billion supported a $7 billion debt reduction: Exxon also returned $9.4 billion through dividends and buybacks. Sustaining those uses alongside $28 billion to $33 billion of annual investment would support per-share value.
Read More: Natural Gas Price Prediction 2026: $15 Global Energy Shock or U.S. Glut Trap?
ExxonMobil (XOM) Price Prediction 2026: Bull, Base and Bear Scenarios
XOM's outlook depends on whether advantaged production and cost reductions can preserve cash flow after Q2's exceptional commodity backdrop. The operating base is strong, yet the $165.23 reference close already discounts part of the recovery.
The Bull Case: Higher Oil Prices and Production Growth Push XOM Toward $205
The Bull Case assumes oil stays elevated, Permian production builds on the Q2 record of 1.8 million barrels per day and Guyana projects expand without major delays. Strong refining margins keep free cash flow sufficient for investment, dividends and the $20 billion annual buyback program.
A move toward $205 would require production to progress toward the 5.5 million boe/d 2030 target, net debt to keep falling after the $7 billion Q2 reduction and cost savings to approach $20 billion. Earnings revisions above the $185 Street high would strengthen the case.
The Base Case: Steady Oil Demand Keeps XOM Between $165 and $185
The Base Case assumes oil and refining margins moderate, while advantaged assets and cost reductions keep cash flow durable. Permian, Guyana and LNG growth offsets mature-field decline, with annual capital spending staying within the planned $28 billion to $33 billion range.
Under this scenario, XOM could trade mainly between $165 and $185, broadly aligned with the latest analyst cluster. Free cash flow above investment needs and steady repurchases would support the range, while weaker margins or rising net debt would pressure the upper end.
The Bear Case: Lower Oil Prices Pull XOM Toward $130
The Bear Case assumes oil prices retreat, refining margins compress and Middle East disruption removes more production. That would weaken both upstream and refining earnings while reducing the $17.2 billion quarterly free-cash-flow run rate.
A move toward $130 would become more likely if earnings revisions fall, advantaged projects slip or buybacks slow from the $5.1 billion Q2 pace. Lower cash conversion and a weaker valuation multiple would pressure the stock despite Exxon's financial strength.
XOM Stock Price Forecasts for 2026 By Wall Street Analysts
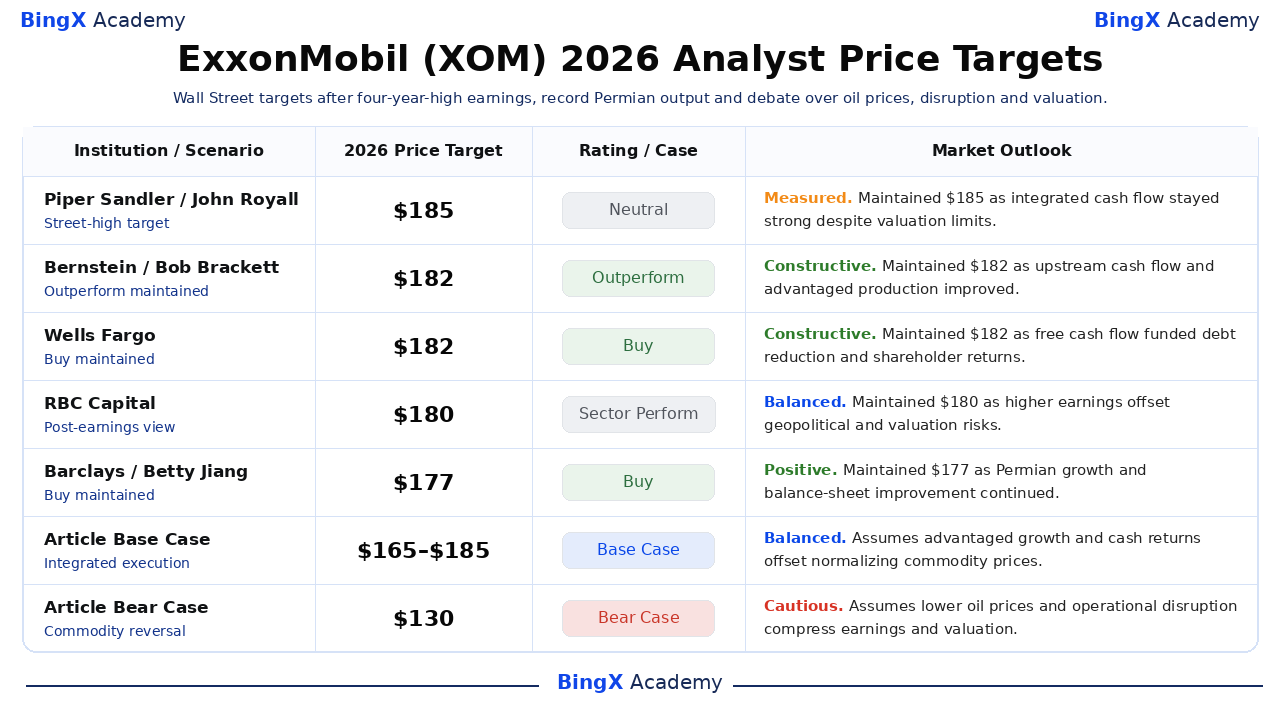
Wall Street targets remain closely grouped after the Q2 report. The five selected real targets span $177 to $185 against the $165.23 reference close. That narrow range signals confidence in Exxon's asset quality, yet also shows that analysts see limited room for execution errors after the stock's roughly 30% advance.
|
Institution / Scenario |
2026 Price Target |
Rating / Case |
Market Outlook |
|
Piper Sandler |
$185 |
Neutral |
Measured. September 3: maintained the Street-high target as integrated cash flow remained strong despite valuation constraints. |
|
Bernstein |
$182 |
Outperform |
Constructive. August 3: maintained Outperform after stronger upstream cash generation and advantaged production growth. |
|
Wells Fargo |
$182 |
Buy |
Constructive. July 31: maintained Buy as free cash flow supported debt reduction and shareholder returns. |
|
RBC Capital |
$180 |
Sector Perform |
Balanced. July 31: maintained a neutral rating as higher earnings were balanced by geopolitical and valuation risks. |
|
Barclays |
$177 |
Buy |
Positive. September 10: maintained Buy as Permian growth and balance-sheet improvement supported the outlook. |
|
Morgan Stanley |
$177 |
Overweight |
Positive. August 20: reiterated Overweight as advantaged assets and capital returns supported per-share value. |
|
Article Base Case |
$165–$185 |
Base Case |
Balanced. Assumes advantaged growth and cash returns offset normalizing commodity prices. |
|
Article Bear Case |
$130 |
Bear Case |
Cautious. Assumes lower oil prices and operational disruption compress earnings and valuation. |
How to Trade ExxonMobil (XOM) Stock on BingX
Trade Exxon's production, refining and shareholder-return outlook using BingX TradFi and BingX AI tools. Because XOM reacts to commodity prices, geopolitical news and project execution, traders should define both the catalyst and risk limits before entering.
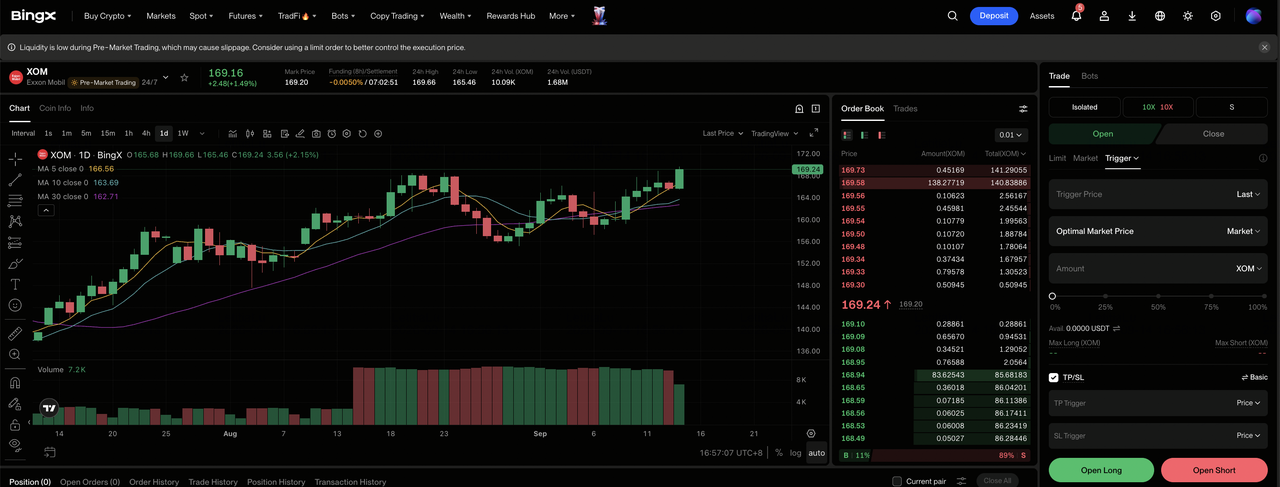
Step 1: Access BingX TradFi. Sign up and navigate to the specialized TradFi section on the BingX exchange dashboard.
Step 2: Select ExxonMobil (XOM). Search for and select the XOM-USDT perpetual futures contract.
Step 3: Choose your direction. Select Open Long if advantaged production and cash returns remain strong. Select Open Short if lower oil prices or disruption weakens earnings.
Step 4: Select leverage and margin mode. Choose Isolated or Cross-Margin based on your risk tolerance. The roughly 30% YTD gain shows why conservative leverage and clear position sizing matter.
Step 5: Execute strict risk protocols. Set Take-Profit and Stop-Loss (TP/SL) levels before or immediately after entering the trade. XOM can react quickly to oil prices, refining margins, production updates and geopolitical developments.
Top 5 Risks to Watch for ExxonMobil Investors in 2026
Exxon's integrated portfolio reduces reliance on one business, though commodity prices, project execution and capital allocation still affect cash flow and per-share value.
- Lower oil prices could cut earnings quickly: Adjusted earnings reached $14.7 billion as crude prices strengthened. A sustained decline would pressure upstream margins and leave less cash after $28 billion to $33 billion of annual capex.
- Middle East shutdowns could reduce production: Output held near 4.5 million boe/d despite disruptions in Qatar and the UAE. Longer outages could reduce sales even if tighter supply supports higher prices.
- Project delays could slow Exxon's 2030 growth plan: Exxon targets 5.5 million boe/d and 65% of volumes from advantaged assets by 2030. Delays in Guyana, LNG or Permian development would postpone earnings growth.
- Lower refining margins could pressure earnings: Refining generated $4.1 billion in Q2 as product markets tightened. Weaker demand, higher supply or extended maintenance could reduce Product Solutions earnings.
- Buybacks depend on strong free cash flow: Exxon returned $9.4 billion and reduced net debt by $7 billion in Q2. Weaker cash flow could slow the $20 billion annual buyback plan.
Final Thoughts: Is XOM a Good Investment in 2026?
ExxonMobil combines record Permian production, expanding Guyana assets and an integrated refining platform with strong financial capacity. Q2 adjusted earnings of $14.7 billion and free cash flow of $17.2 billion funded dividends, repurchases and debt reduction simultaneously. That operating and financial execution supports the $165–$185 Base Case despite a more demanding valuation after the 2026 rally.
The central question is whether durable operating improvements can outlast exceptional commodity conditions. Conservative investors should monitor production against the 5.5 million boe/d 2030 roadmap, refining margins, annual capital spending, free cash flow and net debt. Progress across all five measures would strengthen the route toward $205, while simultaneous deterioration would favor the $130 Bear Case.
Risk Reminder: Trading and investing in XOM involves a high risk of capital loss. Commodity prices, production outages, refining margins, geopolitical disruption, project execution, regulation and valuation changes can materially affect the stock. Conduct independent research and use disciplined position sizing.
Related Reading
- Top Energy Stocks and ETFs to Buy in 2026: The AI Power Crunch Meets Geopolitical Volatility
- Top AI Energy Stocks to Buy in 2026: Nuclear, Gas, Fuel Cells, and the AI Power Buildout
- Natural Gas Price Prediction 2026: $15 Global Energy Shock or U.S. Glut Trap?
- SLB Stock Prediction 2026: $83 Digital AI Breakout or $48 Geopolitical Trap?
- NuScale Power (SMR) Price Prediction 2026: Clean Energy Breakthrough or Capital-Intensive Mirage?
