
Taiwan Semiconductor Manufacturing (TSM) entered late July 2026 after one of the strangest reactions to a record quarter in its history. On July 16, the company reported second-quarter revenue of $40.20 billion and net income of NT$706.56 billion, with diluted EPS up 77.4% year over year, then guided third-quarter revenue to $44.6 billion to $45.8 billion. TSM shares fell anyway, closing near $398 by July 17 after opening the month around $465.
The results were not the problem. Gross margin reached 67.7% and operating margin 60.3%, both at or above the top of guidance, while advanced technologies at 7-nanometer and below delivered 77% of wafer revenue. What unsettled the market was the spending. TSMC raised its 2026 capital expenditure plan to $60 billion to $64 billion from $52 billion to $56 billion and confirmed an additional $100 billion for Arizona, taking its cumulative U.S. commitment to $265 billion.
The TSM stock forecast for 2026 now centers on two competing views:
- The demand case: Bulls expect the 2-nanometer ramp, CoWoS packaging scarcity and Q3 guidance implying another 12% sequential step to confirm that AI orders are still accelerating, with analyst targets running toward $527.
- The capex case: Bears see a $10 billion guidance raise in spending, margin dilution from overseas fabs, and a U.S. build-out that converts a high-return foundry into a more capital-hungry one.
This guide breaks down the TSM stock forecast, 2026 price scenarios, key risks, and research from TD Cowen, Bank of America and the broader Street, drawing on the July 16 earnings release and the Q2 investor call, plus how to trade TSM stock futures on BingX TradFi with USDT collateral.
Top 5 Things for TSM Investors to Know in July 2026
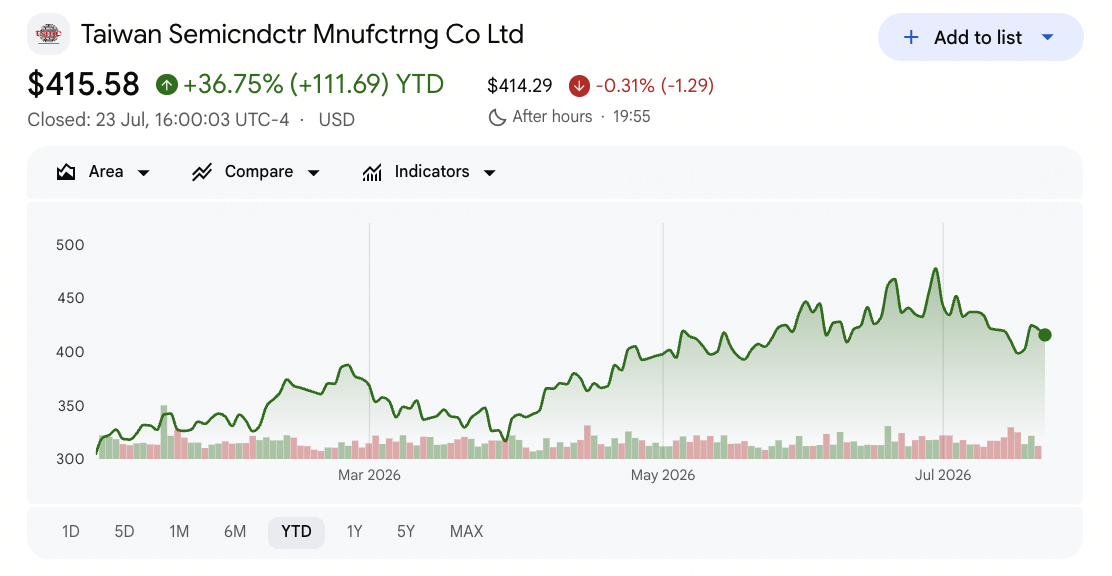
- Q2 revenue of $40.20 billion grew 33.7% in U.S. dollar terms: Consolidated revenue reached NT$1,270.38 billion, up 36.0% year over year and 12.0% sequentially, with net income of NT$706.56 billion and diluted EPS of NT$27.25, or $4.31 per ADR unit.
- Net income and EPS both grew 77.4%: Earnings grew more than twice as fast as revenue, with gross margin at 67.7%, operating margin at 60.3% and net profit margin at 55.6%.
- Q3 guidance implies another step up to roughly $45 billion: Management guided third-quarter revenue of $44.6 billion to $45.8 billion with gross margin of 65% to 67%, citing the steep ramp of 2-nanometer technology.
- Capex guidance was raised to $60 billion to $64 billion: The increase from $52 billion to $56 billion, alongside a further $100 billion committed to Arizona and a cumulative $265 billion U.S. investment, was the single largest driver of the negative stock reaction.
- 2-nanometer entered the revenue mix at 3%: N2 contributed 3% of wafer revenue in its first meaningful quarter, with 3-nanometer at 30%, 5-nanometer at 33% and 7-nanometer at 11%, taking advanced technologies to 77% of the total.
What Is Taiwan Semiconductor Manufacturing Company (TSM)?
Taiwan Semiconductor Manufacturing Company (TSMC), founded in 1987 and headquartered in Hsinchu, pioneered the pure-play foundry model and remains the world’s leading dedicated semiconductor manufacturer. It does not design chips or compete with its customers. Instead, it manufactures chips for major technology companies including Apple, Nvidia, AMD, Broadcom, Qualcomm, and MediaTek, which is why nearly every advanced AI processor passes through a TSMC fab.
The scale is difficult to replicate. TSMC deployed 305 distinct process technologies and manufactured 12,682 products for 534 customers in 2025. Its economic advantage sits at the leading edge, where 7-nanometer and below now accounts for 77% of wafer revenue and supports the pricing power visible in a 67.7% gross margin. High-performance computing, which includes AI accelerators, has become its dominant platform. Beyond wafers, TSMC controls CoWoS advanced packaging, a key bottleneck that determines how many AI accelerators the industry can ship each quarter. Manufacturing spans Asia, Europe, and North America, with the Arizona expansion now representing a cumulative $265 billion U.S. commitment.
TSMC (TSM) Q2 2026 Earnings: What Drove Record Revenue and 77% Profit Growth
- Leading-edge demand drove the top line. Huang attributed the quarter to strong demand for leading-edge process technologies, with advanced nodes at 7-nanometer and below delivering 77% of wafer revenue.
- Margins expanded faster than revenue. Gross profit rose 57.2% and income from operations rose 65.4%, both well ahead of the 36.0% revenue increase, producing net income growth of 77.4%.
- The 3-nanometer and 5-nanometer nodes carried the mix. N3 contributed 30% of wafer revenue and N5 contributed 33%, together accounting for nearly two-thirds of the total while N2 began its ramp at 3%.
- Sequential growth accelerated. Revenue rose 12.0% from Q1 and net income rose 23.4%, indicating the AI order book was still building through the quarter rather than flattening.
- The capex raise reframed the story. Lifting 2026 capital spending to $60 billion to $64 billion signalled confidence in multi-year demand, but also told investors that free cash flow will be consumed by construction for several years.
TSMC Q2 2026 Financial and Consensus Profile: Revenue, EPS and Margins
TSMC's Q2 print showed a company beating on essentially every operating line while raising the capital intensity of the business. The gap between the operating result and the share price reaction is the central fact of the quarter.
|
Financial Metric |
Guidance / Consensus |
Reported / Actual |
Surprise |
|
Q2 2026 Revenue (USD) |
$39.0 to $40.2 billion guided |
$40.20 billion |
Top of guidance; up 33.7% year over year |
|
Q2 2026 Revenue (NT$) |
— |
NT$1,270.38 billion |
Up 36.0% year over year, up 12.0% sequentially |
|
Q2 2026 Diluted EPS |
~$3.83 per ADR consensus |
NT$27.25 ($4.31 per ADR) |
Beat; up 77.4% year over year |
|
Q2 2026 Net Income |
— |
NT$706.56 billion |
Up 77.4% year over year, up 23.4% sequentially |
|
Q2 2026 Gross Margin |
65.5% to 67.5% guided |
67.70% |
Above the top of guidance |
|
Q2 2026 Operating Margin |
— |
60.30% |
Income from operations up 65.4% |
|
Q2 2026 Advanced Technologies |
— |
77% of wafer revenue |
N2 at 3%, N3 at 30%, N5 at 33%, N7 at 11% |
|
Q3 2026 Revenue Guidance |
— |
$44.6 to $45.8 billion |
Implies roughly 12% further sequential growth |
|
FY2026 Capex Guidance |
$52 to $56 billion prior |
$60 to $64 billion |
Raised roughly $10 billion; the main negative catalyst |
For context, Q1 2026 delivered NT$1,134.10 billion of revenue with net income of NT$572.48 billion and EPS of NT$22.08. First-half 2026 revenue reached NT$2,404.48 billion, up 35.6% year over year, and June alone produced NT$442.68 billion, up 67.9%. TSMC had beaten consensus in each of the four quarters preceding this print, with an average positive surprise of 8.34%. Management has guided to full-year 2026 growth above 30% in U.S. dollar terms, and Q3 guidance of $44.6 billion to $45.8 billion keeps that intact.
TSMC (TSM) 2026 Investment Outlook: $527 Bull Case vs. $390 Bear Case
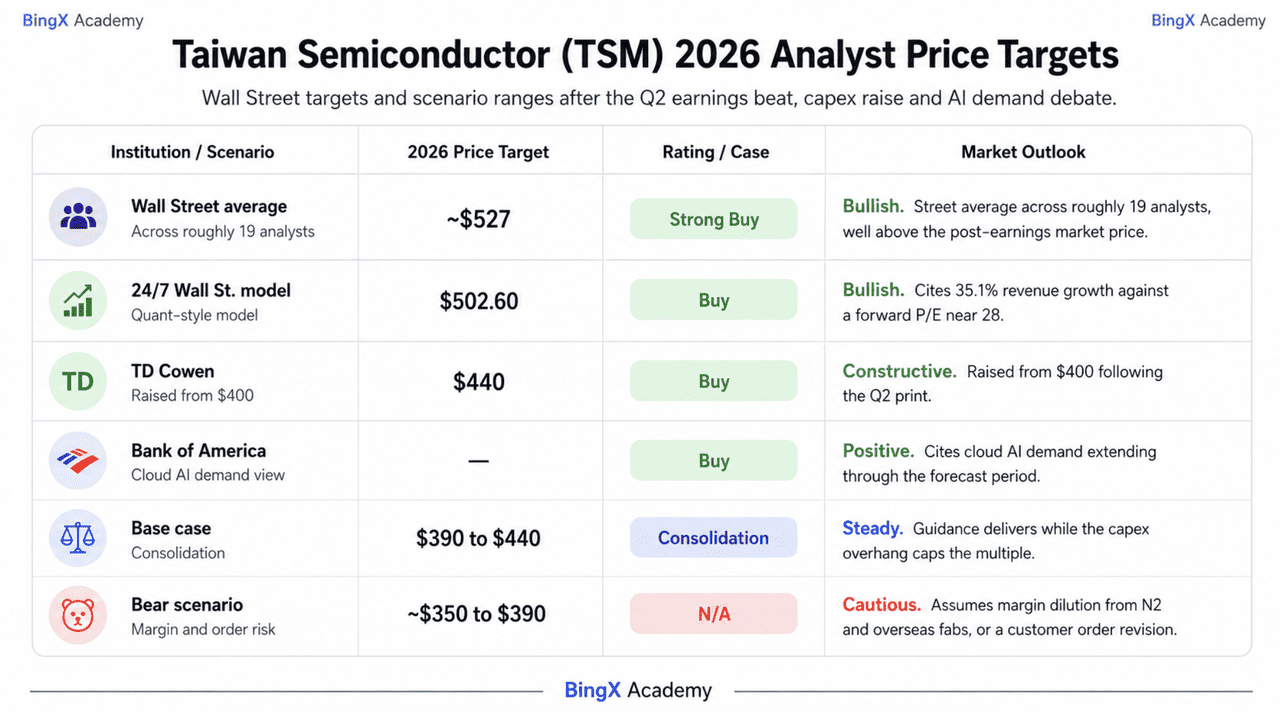
TSMC's outlook for the rest of 2026 depends on one central question: whether a $10 billion capex increase is evidence of demand visibility or the start of a structurally more capital-intensive business.
The Bull Case: N2 Growth and Pricing Power Push TSM Toward $527
The bull case rests more on forward guidance than the reported quarter. Q3 revenue of $44.6 billion to $45.8 billion implies another 12% sequential increase after Q2 already grew 12%, which suggests the AI cycle remains strong. Management also highlighted the rapid ramp of 2-nanometer production, a higher-priced node that contributed only 3% of wafer revenue and still has significant room to expand.
This scenario requires margins to remain resilient as N2 scales and overseas fabs absorb higher costs. TD Cowen raised its target to $440, while the broader Street average sits near $527 with a Strong Buy consensus. Revenue growth of 36%, a 67.7% gross margin, and TSMC’s control of advanced packaging capacity support the case for durable pricing power. If the higher capex reflects committed customer demand, the decline from roughly $465 into the high $390s may prove to be an entry point.
The Base Case: Strong Earnings and Capex Concerns Keep TSM Between $390 and $440
In the base case, TSMC delivers its guidance but the market continues to discount the scale of its spending. Q3 revenue lands within the $44.6 billion to $45.8 billion range, full-year dollar revenue grows more than 30%, and the stock trades sideways while investors assess the returns from its Arizona expansion.
Advanced technologies account for 77% of wafer revenue, while the 67.7% gross margin provides a strong earnings floor. The capex overhang, however, limits multiple expansion. The high $390s remain the near-term base, while TD Cowen’s $440 target represents the first meaningful resistance level.
The Bear Case: Overseas Fab Costs and Margin Pressure Pull TSM Toward $350
The bear case does not require AI demand to collapse. It only requires the cost of meeting that demand to rise faster than expected. TSMC guided Q3 gross margin to 65% to 67%, below the latest 67.7%, while the N2 ramp and overseas fab expansion could reduce margins by roughly two to three percentage points.
The main trigger would be a major customer cutting capacity plans while construction spending remains elevated. TSMC also has substantial customer concentration, with its ten largest customers representing about 85% of accounts receivable. Combined with geopolitical risk and growing capital intensity, any order revision could compress the valuation and push the stock toward the mid-$350s.
TSM Stock Price Forecasts for 2026 By Wall Street Analysts
Wall Street remains overwhelmingly positive on TSMC and the post-earnings target revisions moved higher, not lower, which is the clearest signal that the Street reads the capex raise as demand-driven rather than defensive.
|
Institution |
2026 Price Target |
Rating |
Market Outlook |
|
Wall Street average |
~$527 |
Strong Buy |
Street average across roughly 19 analysts, well above the post-earnings market price. |
|
24/7 Wall St. model |
$502.60 |
Buy |
Bullish. Cites 35.1% revenue growth against a forward P/E near 28. |
|
TD Cowen |
$440 |
Buy |
Constructive. Raised from $400 following the Q2 print. |
|
Bank of America |
— |
Buy |
Positive. Cites cloud AI demand extending through the forecast period. |
|
Base case |
$390 to $440 |
Consolidation |
Steady. Guidance delivers while the capex overhang caps the multiple. |
|
Bear scenario |
~$350 to $390 |
N/A |
Cautious. Assumes margin dilution from N2 and overseas fabs, or a customer order revision. |
How to Trade Taiwan Semiconductor (TSM) Stock on BingX
Navigate the volatility of TSMC's earnings cycle using BingX TradFi and BingX AI tools, where TSMC exposure trades as TSMU.
TSMU is the GraniteShares 2x Long TSM Daily ETF, which delivers twice the daily return of Taiwan Semiconductor shares, so a 3% move in TSM becomes roughly 6% in TSMU, in both directions. Because that 2x target resets daily, TSMU suits short-horizon directional trades around catalysts like quarterly releases rather than long holds.
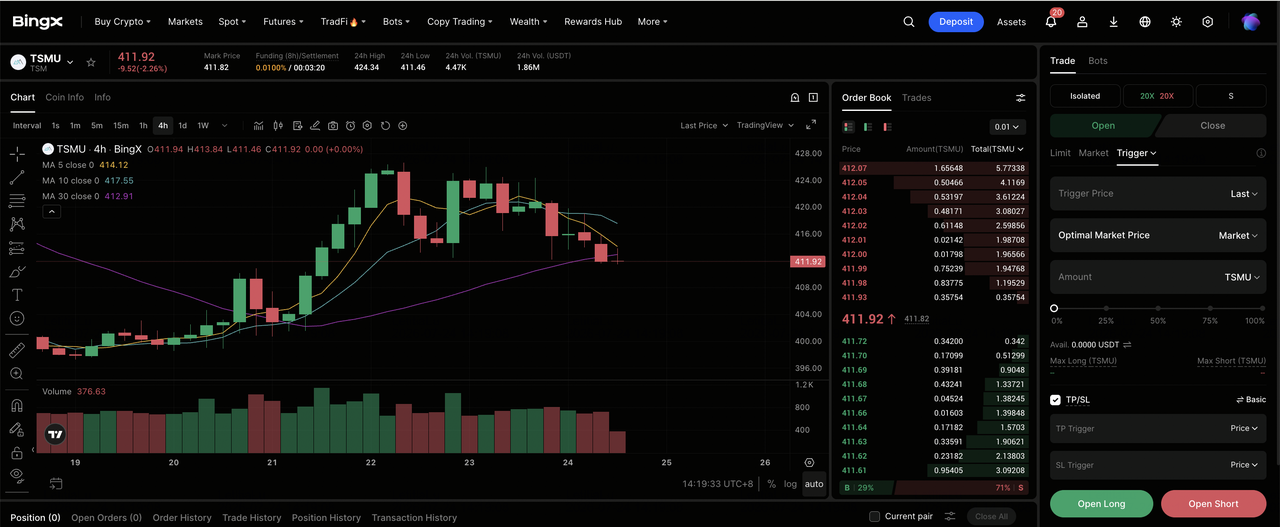
Step 1: Access BingX TradFi. Sign up and navigate to the specialized TradFi section on the main BingX exchange dashboard.
Step 2: Select TSMU. Search for and select the TSMU-USDT perpetual futures contract.
Step 3: Choose your direction. Select Open Long if you expect Q3 revenue to land inside the $44.6 billion to $45.8 billion guide, the 2-nanometer ramp to lift pricing, and the capex raise to be re-read as demand visibility. Select Open Short if you expect overseas fab costs to dilute margins further, a hyperscaler to trim capacity plans, or rising capital intensity to compress the multiple.
Step 4: Select leverage and margin mode. Choose Isolated or Cross-Margin based on your risk tolerance. Because TSMU already carries 2x daily exposure and TSM fell from around $465 to the high $390s within a single month, conservative leverage and clear position sizing are important.
Step 5: Execute strict risk protocols. Set Take-Profit and Stop-Loss (TP/SL) levels before or immediately after entering the trade. TSMU can react quickly to monthly revenue disclosures, quarterly earnings, hyperscaler capex commentary, CoWoS capacity updates, U.S. tariff and export policy headlines, and Taiwan geopolitical news.
Top 5 Risks to Watch for TSM Investors in 2026
To navigate the second half of 2026, investors must weigh TSMC's foundry monopoly economics against these five structural and macro headwinds.
- Capital intensity is rising sharply: The 2026 capex guide moved to $60 billion to $64 billion from $52 billion to $56 billion, with a cumulative $265 billion committed to the United States. Free cash flow is consumed by construction well before the revenue arrives.
- Overseas fabs and the N2 ramp dilute margins: Q3 gross margin guidance of 65% to 67% sits below the 67.7% just delivered, and management has flagged several points of dilution from N2 ramp costs and higher-cost overseas manufacturing.
- Customer concentration is extreme: The top ten customers represent roughly 85% of accounts receivable. A single hyperscaler or accelerator designer revising orders moves TSMC's entire model.
- The AI peak-out debate applies directly: TSMC sits at the front of the order chain, so any deceleration in hyperscaler capital spending shows up in its wafer starts and packaging reservations before it appears anywhere else.
- Taiwan geopolitical and tariff risk remains unresolved: Concentration of the most advanced manufacturing capacity on a single island, combined with U.S. pressure to relocate production, is a permanent discount that no quarterly result can remove.
Final Thoughts: Should You Invest in TSMC in 2026?
TSMC’s July 16 report reinforced its operational strength but shifted attention to rising capital intensity. Revenue reached $40.20 billion, gross margin was 67.7%, earnings rose 77.4%, and Q3 revenue guidance approached $45 billion. The debate is whether planned annual capex of $60 billion to $64 billion supports long-term AI growth or justifies a lower multiple.
Bulls see the capex raise as a strong demand signal and view the share-price reset as excessive. Bears point to margin pressure from N2 and overseas fabs, customer concentration, and a more capital-heavy model. Long-term AI investors may still see TSMC as a direct way to express that view, while cautious traders may wait for Q3 confirmation, with the $390s as support and $440 as the key recovery level.
Risk Reminder: Trading and investing in equities like TSM involves a high risk of capital loss. TSMC is exposed to semiconductor cyclicality, extreme customer concentration, export controls and Taiwan geopolitical risk, any of which can move the stock independently of its earnings. Conduct independent research before allocating capital.
Related Reading
- ASML (ASML) Price Prediction 2026: Can a Third Guidance Raise Push ASML Past $2,000?
- Nvidia (NVDA) Stock Price Outlook for 2026: Can Blackwell and Vera Rubin Take NVDA Back to $300?
- Apple (AAPL) Stock Outlook for 2026: MacBook Neo Growth or AI Valuation Trap?
- Micron Stock Price Prediction 2026: $1,500 AI Supercycle or Peak Margin Cyclical Trap?
- Broadcom (AVGO) Stock Outlook for 2026: AI Infrastructure King or Margin Victim?
- Qualcomm (QCOM) Stock Price Prediction 2026: Can QCOM Break $260 on Edge AI Growth?
