

Bitcoin enters 2026 at a crossroads: institutions like Grayscale project a new all-time high in the first half of the year, while Bernstein’s revised $150,000 target for 2026 and on-chain metrics such as the MVRV (market value to realized value) spread signal that the market may still be working through a deeper, extended correction. ETF-driven liquidity, regulatory clarity, and macro shifts paint a structurally bullish long-term picture, but the data also shows real risk of late-2026 downside before any sustained breakout.
For crypto traders, this means 2026 won’t be a clean “bull or bear” year, but a post-halving volatility cycle defined by sharp reversals, contested ranges, and growing divergence between institutional flows and on-chain stress indicators. This guide will explore the competing forecasts, key data models, and trading scenarios shaping Bitcoin’s next major move.
Key Highlights
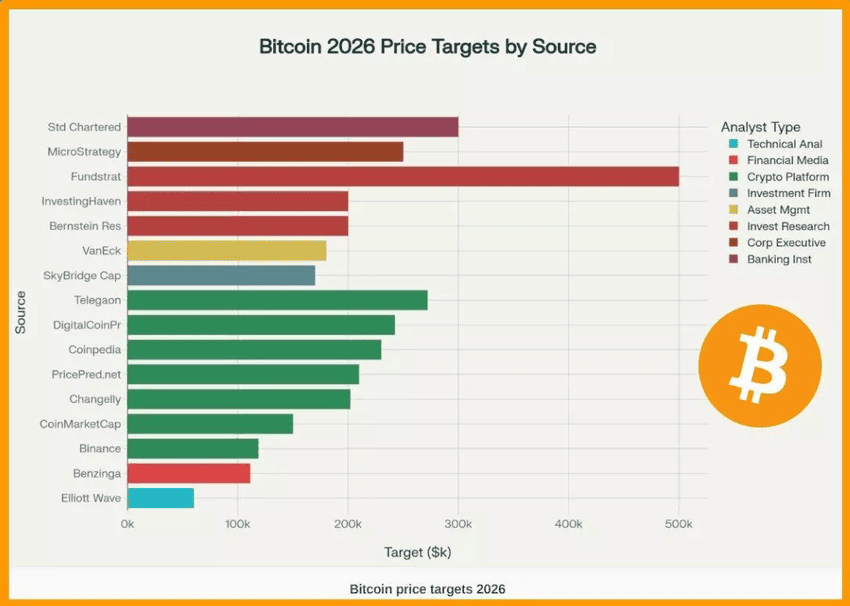
Bitcoin price targets for 2026 | Source: CryptoRank
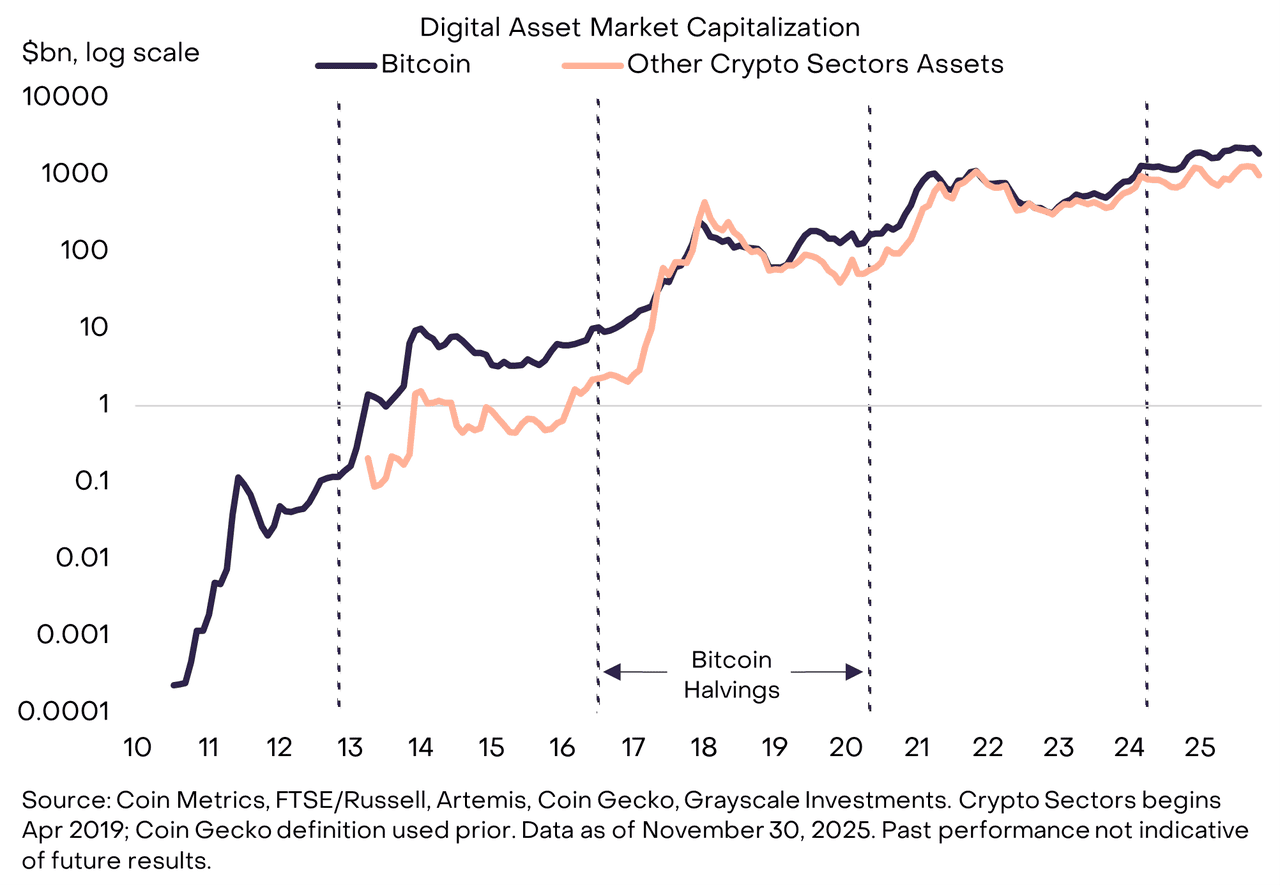
Following the April 2024 halving, Bitcoin’s block rewards fell from 6.25 BTC to 3.125 BTC, driving its annualized inflation rate below that of gold and opening the typical 12–18-month post-halving window that extends into 2026. At the same time, the market has shifted firmly into the institutional era: spot Bitcoin ETFs now control more than $100 billion in assets, and despite a sharp 30% pullback from the 2025 peak, outflows from these funds have remained modest, suggesting that long-term, regulated capital is still anchoring Bitcoin’s demand.
1. Bull case for 2026: Grayscale and Bitwise expect a new ATH in H1 2026 as macro liquidity improves and US/EU crypto rules stabilize, with targets in the $120,000–$150,000+ range from major banks and brokerages.
2. Bear case for 2026: On-chain indicators like MVRV Z-Score and long-term moving averages flag a deep bear phase, with some analysts eyeing $40,000–$80,000 as potential downside zones before a new cycle.
3. Cycle debate: Multiple institutions, including Grayscale, Standard Chartered, Bernstein, and Bitwise, now argue that the four-year halving rhythm is weakening, replaced by ETF flows, digital-asset treasuries (DATs), and macro liquidity as main drivers.
What Is the Bitcoin Post-Halving Cycle and Where Is BTC in the Cycle Now?
To understand Bitcoin’s position today, it helps to revisit the traditional four-year halving cycle, a pattern created by Bitcoin’s code, which cuts miner rewards by 50% roughly every four years. This built-in supply shock historically triggers a predictable sequence: a period of consolidation, followed by a strong 12–18-month rally as reduced issuance meets rising demand.
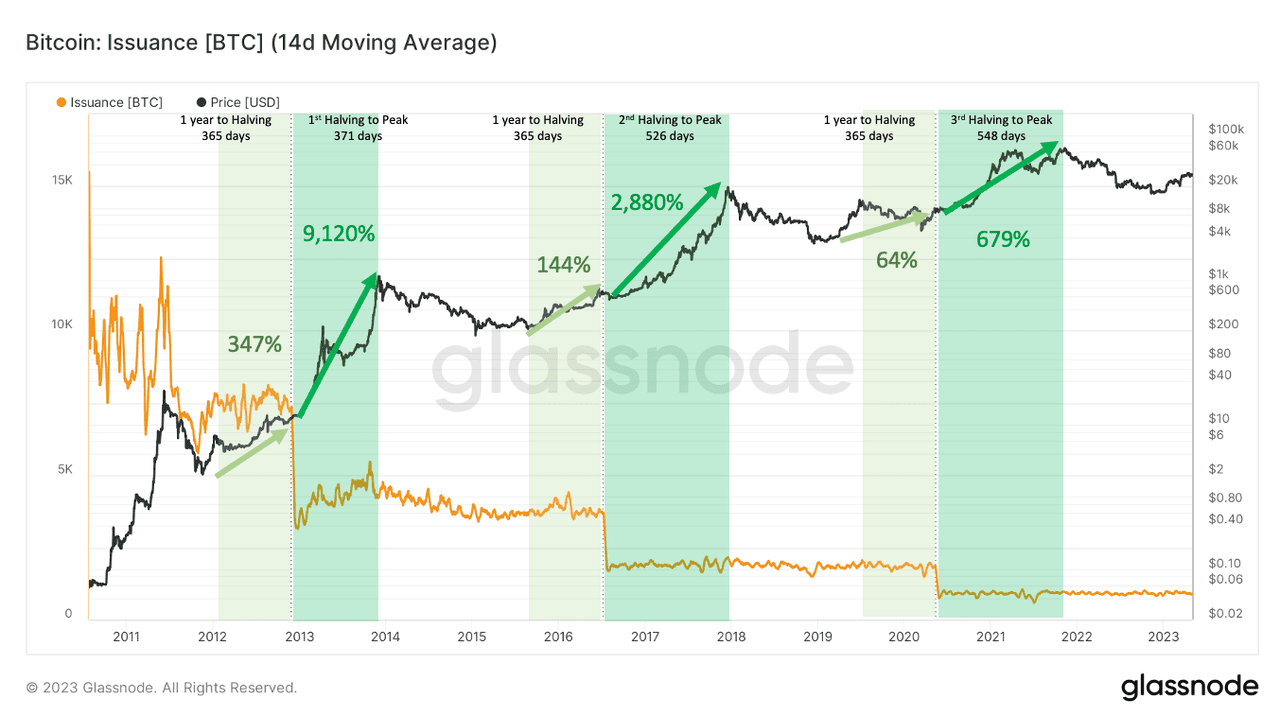
Previous Bitcoin halving cycle gains | Source: Blockforce Capital
The results have been dramatic. After the 2012 halving, Bitcoin surged over 9,000%; the 2016 halving produced a 2,800% run; and the 2020 halving delivered a 650%+ gain as institutional interest entered the market. These cycles helped establish the idea that each halving sets the foundation for Bitcoin’s next major bull market.
What Makes the 2024 BTC Halving Cycle Different?
The 2024 halving again tightened supply, cutting rewards from 6.25 BTC to 3.125 BTC per block, but it did so in a fundamentally transformed market. Bitcoin crossed $126,000 in October 2025, but instead of a parabolic continuation, it dropped roughly 30% into the mid-$80,000–$90,000 range amid heavy liquidations and temporary ETF outflows. At the same time, spot Bitcoin ETFs now hold over $100 billion, and exchange reserves sit near multi-year lows as more BTC moves into ETFs, corporate treasuries, and long-term “HODLer” wallets. This reduces the fast-moving supply that previously fueled explosive rallies.
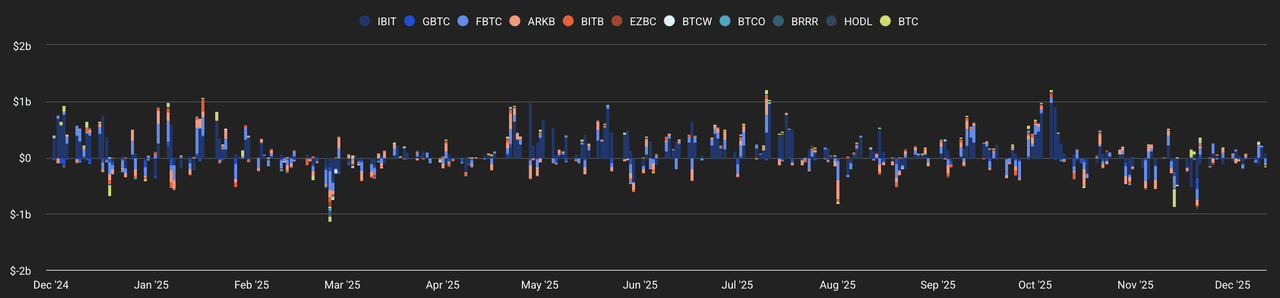
Spot Bitcoin ETF flows | Source: TheBlock
As a result, Bitcoin still displays some traits of a post-halving expansion phase, but institutional capital, regulated products, and risk-managed flows are reshaping how the cycle behaves. The boom-and-bust extremes of earlier eras are flattening, making 2026 a highly contested year where Bitcoin can justifiably be labeled either early-stage bull or extended consolidation, depending on which data points traders prioritize.
Bitcoin's Bull Case for 2026: Institutional, Regulatory and Macro Tailwinds
Here’s how the strongest data-backed drivers, institutions, regulation, and macro liquidity, lay the foundation for Bitcoin’s bullish scenario in 2026.
1. New ATHs and the “Institutional Era” Thesis
2026 may be the year digital assets enter their institutional era.
— Grayscale (@Grayscale) December 15, 2025
Grayscale believes macro tailwinds and regulatory clarity will drive demand for scarce assets like $BTC & $ETH. 🧵👇https://t.co/ReaqqGksni
Grayscale’s 2026 Digital Asset Outlook frames next year as the “dawn of the institutional era.” The firm expects:
• Bitcoin to reach a new all-time high in H1 2026.
• A gradual end to the four-year halving cycle narrative, with price driven more by ETF flows, stable regulation, and macro demand for non-sovereign value stores.
• Bipartisan US crypto market-structure legislation to pass in 2026, cementing digital assets inside US capital markets and reducing regulatory overhang.
Bernstein: "In view of recent market correction, we believe, the Bitcoin cycle has broken the 4-year pattern (cycle peaking every 4 years) and is now in an elongated bull-cycle with more sticky institutional buying offsetting any retail panic selling.
— matthew sigel, recovering CFA (@matthew_sigel) December 8, 2025
Despite a ~30% Bitcoin…
Meanwhile:
• Bernstein now targets $150,000 by 2026 and a $200,000 cycle peak in 2027, while keeping a $1 million target for 2033, arguing that ETF demand and constrained supply still support a long-term uptrend.
• Standard Chartered also reduced its forecasts but still sees Bitcoin at $150,000 in 2026, even after cutting year-end 2025 expectations to $100,000.
• Bitwise CEO Hunter Horsley openly declares the four-year cycle “dead” and expects a “massive 2026” bull run driven by matured infrastructure and institutional allocations.
Across these views, a common theme emerges: institutional structure will overshadow the retail cycle.
2. Macro Liquidity and Fiat Debasement Risk
Grayscale highlights rising public debt and the risk of fiat debasement as a key pillar for BTC demand, especially if real yields fall while central banks move back toward balance-sheet expansion.
Other macro points:
• A series of rate cuts into 2026 would historically favor risk assets and alternative stores of value like Bitcoin.
• Growing stablecoin and tokenized-asset adoption could create more on-ramps for capital to rotate into BTC and other majors.
In this bull scenario, 2026 looks like an institutional-driven continuation of the post-halving expansion: maybe less explosive than 2017/2021, but more persistent and integrated into global portfolios.
Bear Case for 2026: Extended Drawdown and On-Chain Stress
While institutional research is broadly constructive, on-chain and technical models paint a more cautious picture.
1. MVRV Spread and “Delayed Recovery” Signals
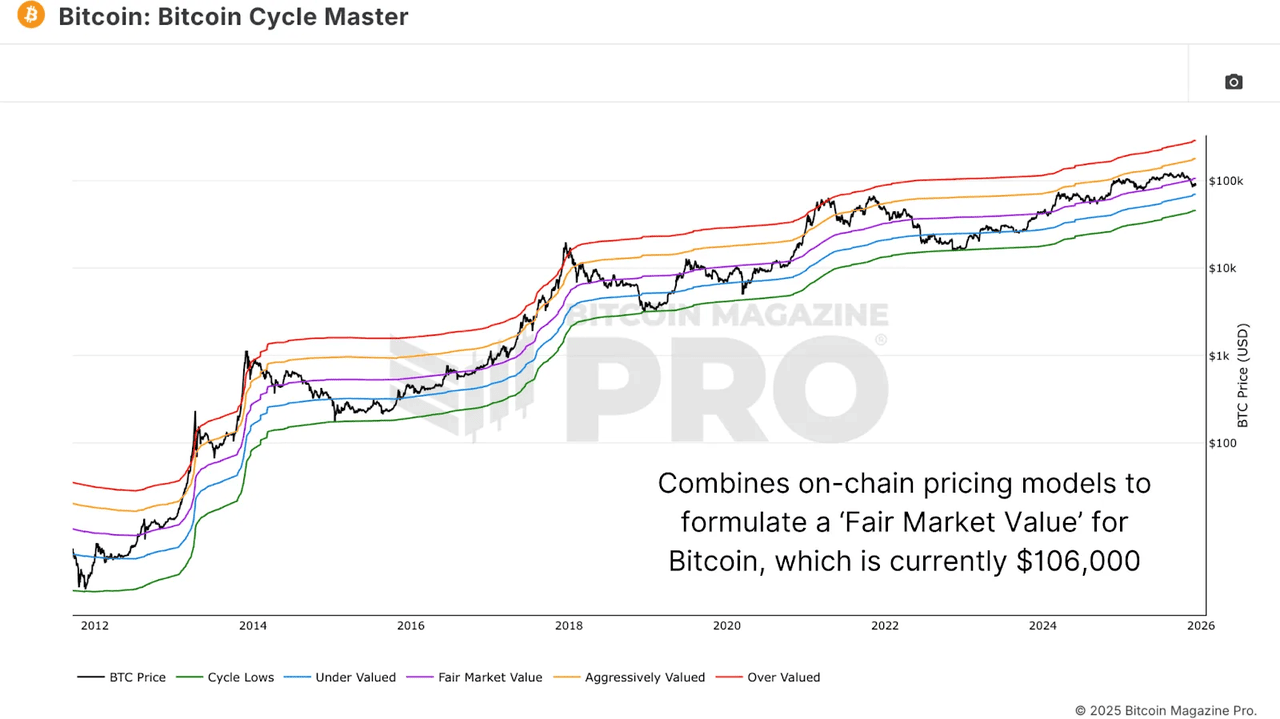
Bitcoin fair market value | Source: Bitcoin Magazine
Analysts tracking the MVRV Z-Score and the spread between 30-day and 365-day MVRV note:
• Short-term holders are deeply underwater relative to long-term holders.
• The spread remains strongly negative, consistent with early or mid-stage bear markets in past cycles.
• Based on prior patterns, the model suggests no sustained bullish shift until the second half of 2026, implying a prolonged choppy or downward phase.
Other analysts highlight:
• Loss of key moving averages like 200-day, 365-day MAs as support, with $74,000–$87,000 flagged as an important demand zone and potential stepping stone toward deeper levels.
• Scenario analysis where BTC could revisit $40,000–$50,000 zones if macro or ETF flows deteriorate sharply, similar to historical 40–60% cycle drawdowns.
2. ETF Flows, DATs, and Liquidity Fragility

Digital asset treasury (DAT) premium compression | Source: Grayscale
Even in a “structural bull,” capital flows can flip short-term price direction:
• Grayscale and Bernstein both highlight that ETF and digital-asset treasury (DAT) flows are now central to Bitcoin’s market structure.
• Standard Chartered notes several weeks of net outflows from major ETFs and pressure on DAT companies whose equity now trades below the value of their BTC holdings, a sign that balance-sheet expansion may slow.
In the bear-leaning scenario, 2026 becomes a “reset year:”
• BTC remains capped below, or only marginally above, prior ATHs.
• The market oscillates between $70,000–$120,000, with spikes and deep pullbacks.
• A true new parabolic leg is delayed to late 2026 or 2027, once weak hands are flushed and on-chain profitability normalizes.
Are BTC Halving Cycles Still Relevant in 2026?
As Bitcoin transitions deeper into the institutional era, traders are increasingly debating whether the classic four-year halving cycle still drives price action the way it once did. With new catalysts, such as ETFs, regulatory clarity, and macro liquidity, playing a much larger role, the 2026 environment raises important questions about how much predictive power the halving truly retains.
The Case for a Fading Four-Year Halving Pattern
Bitcoin's rising valuations could spell the end of the four-year halving cycle | Source: Grayscale
Many major institutions argue that Bitcoin’s traditional cycle structure is weakening. Grayscale suggests we may be witnessing “the end of the so-called four-year cycle,” noting that ETF flows, regulatory frameworks, and global liquidity are now stronger price drivers than programmed supply cuts. Similarly, Standard Chartered and Bernstein have reduced their peak-cycle targets and describe today’s market as an “elongated bull cycle” with smoother, less extreme peaks and more prolonged drawdowns compared with earlier halving eras.
Bitwise’s CEO Hunter Horsley reinforces this view, stating that the halving is “no longer relevant” as a timing model because institutional allocators, BTC digital asset treasuries (DATs), and ETF flows move in response to macroeconomic and policy signals, not Bitcoin’s issuance schedule. In this framework, halving acts more like a background event, while market structure and capital flows dictate the pace and magnitude of price changes.
The Case for Halving as a Long-Term Anchor
Despite these shifts, the halving continues to play a meaningful role in Bitcoin’s long-term valuation. The 2024 supply cut reduced issuance to under 450 BTC per day, pushing Bitcoin’s annual inflation rate below that of gold and reinforcing its scarcity profile, a key pillar of the “digital gold” narrative. This structural reduction in new supply helps support long-term price floors, especially when demand remains steady or increases.
Additionally, widely used on-chain valuation models, such as Stock-to-Flow, CVDD (cumulative value-days destroyed), Terminal Price, and several supply-based metrics, still derive part of their predictive accuracy from Bitcoin’s issuance schedule. While the timing of halving-driven rallies has become less precise in the ETF era, these models continue to highlight where long-term support and resistance levels may form. In 2026, the halving is best understood as a foundational anchor: it influences the broad valuation range but no longer guarantees the classic “12–18 months of straight upside” that characterized earlier cycles.
What Could Bitcoin Price Look Like in 2026: Three Possible Scenarios
Bitcoin’s 2026 outlook is best understood through data-driven scenarios, not a single prediction. ETF flows now account for more than $100 billion of held supply, macro conditions remain volatile, and on-chain indicators such as the MVRV spread still sit below historical bull-market thresholds. These factors create three realistic market paths that traders should prepare for:
1. Institutional Bull: Base-to-Bull Case
Range: BTC trades mostly between $100,000–$170,000, with new ATHs in H1 2026.
In this scenario, Bitcoin reclaims momentum and trades primarily in the $100,000–$170,000 zone, with a realistic chance of printing new all-time highs in H1 2026. ETF inflows resume following 2025’s correction, with regulated funds once again acting as strong net buyers. The US and EU pass long-awaited market-structure and stablecoin regulations, reducing uncertainty and unlocking institutional capital. Meanwhile, rate cuts and declining real yields revive risk appetite across global markets.
This aligns with major forecasts: Grayscale expects a new ATH in early 2026, Bernstein targets $150,000 next year with a potential $200,000 top in 2027, and Standard Chartered maintains a $150,000 target for 2026. These projections reflect a structurally bullish environment driven by regulated inflows and maturing market infrastructure.
2. Range-Bound Grind: Neutral Case
Range: BTC oscillates between $70,000 and $130,000, with repeated failed breakouts.
Here, Bitcoin remains directional but not explosive, oscillating between $70,000–$130,000 through repeated breakout attempts that fail to hold. ETF flows remain flat to mildly positive, providing a floor but not enough sustained momentum to push BTC into a new price regime. Economic conditions offer only partial support; central banks ease modestly, but liquidity does not expand meaningfully enough to fuel a risk-on surge.
On-chain metrics begin to stabilize but recover slowly. The MVRV spread, for example, moves toward neutral territory only by late 2026, signaling a market that is healing but not yet ready for a full bull-cycle expansion. This scenario mirrors mid-cycle consolidation phases seen in past cycles, but stretched by institutional behavior and tighter liquidity conditions.
3. Bear Reset: Bear Case
Range: BTC revisits $40,000–$70,000, with volatility spikes and capitulation events.
In the bearish scenario, Bitcoin falls back into the $40,000–$70,000 zone as key macro shocks hit the market simultaneously. Triggers may include renewed Fed tightening, a Bank of Japan (BOJ) rate hike that drains global liquidity, or a broader risk-off shift across equities and bonds. At the same time, sustained ETF outflows, driven by recession fears, shrinking liquidity, or negative regulatory actions, force institutional players to reduce exposure, adding persistent sell pressure to the market.
On-chain indicators such as MVRV, Puell Multiple, and long-term holder profitability stay deeply depressed until 2027, reflecting a prolonged washout similar to the 2014–2015 or 2018–2019 resets. If this pattern unfolds, Bitcoin may require several more quarters to rebuild the structural momentum needed for the next major bull cycle. This scenario doesn’t predict the future with certainty, but helps traders prepare actionable strategies rather than anchoring to a single bullish or bearish narrative.
No single model can definitively call 2026 a bull or bear year, but laying out these scenarios helps traders build conditional playbooks instead of relying on a single narrative, improving risk management and strategic planning in an increasingly institutional Bitcoin market.
Read more: Will Japan’s Interest Rate Hike Push Bitcoin and Crypto Prices Lower? Key Predictions Explained
How to Trade an Uncertain 2026 Bitcoin Market on BingX
Whether 2026 leans bullish or bearish, volatility is almost guaranteed. Here are ways you can structure your approach on BingX:
1. Trade BTC on the Spot Market

BTC/USDT trading pair on the spot market powered by BingX AI insights
Step 2: Decide whether you want to buy instantly (Market Order) or at a specific level (Limit Order).
Step 3: Use limit orders around major support zones identified by charts or on-chain data, e.g., deep dips into the $70,000–$90,000 region in bearish scenarios.
Step 4: Hold your BTC in your Spot wallet or transfer it to a secure storage method if needed.
Step 5: Review your position periodically and adjust based on ETF flow trends, macro events, or technical signals.
2. Use BingX Recurring Buy to DCA BTC for Low-Stress Accumulation
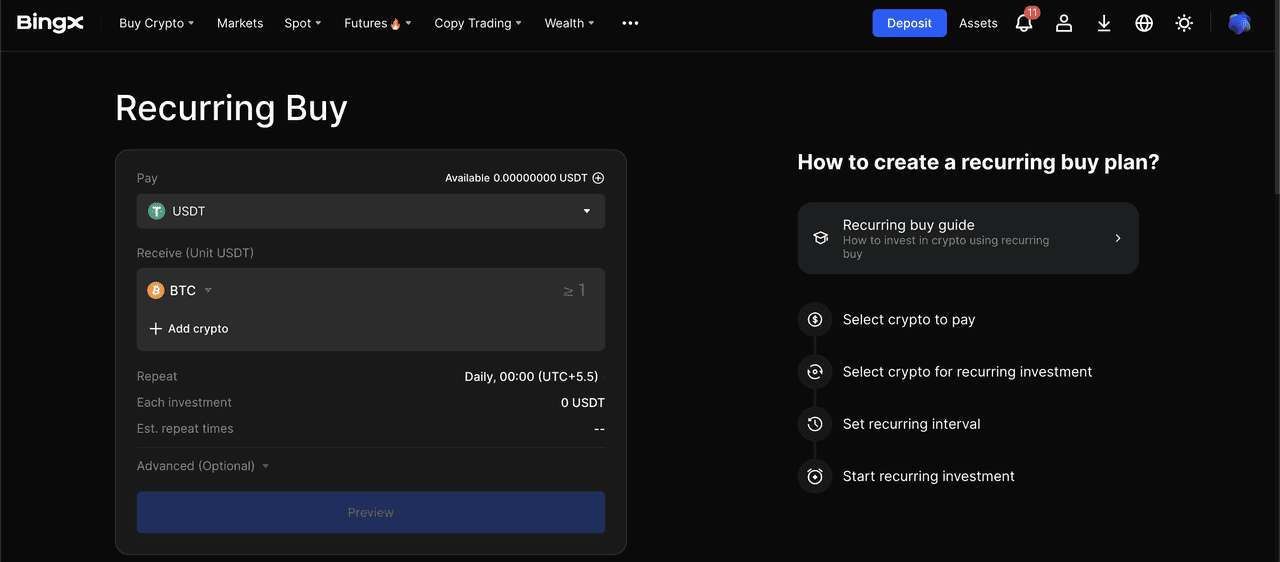
BingX recurring buy for Bitcoin DCA
Step 1: Go to Spot, then select the Recurring Buy feature on BingX.
Step 2: Select BTC as your target asset.
Step 3: Choose a fixed USDT amount, from as low as 1 USDT, and set the frequency, like daily, weekly, or monthly.
Step 4: Confirm the plan so BingX automatically purchases BTC for you at each interval.
Step 5: Let the DCA strategy run, accumulating more BTC during dips and smoothing volatility over time without needing to time the market.
3. Trade BTC Futures for Hedging or Directional Moves
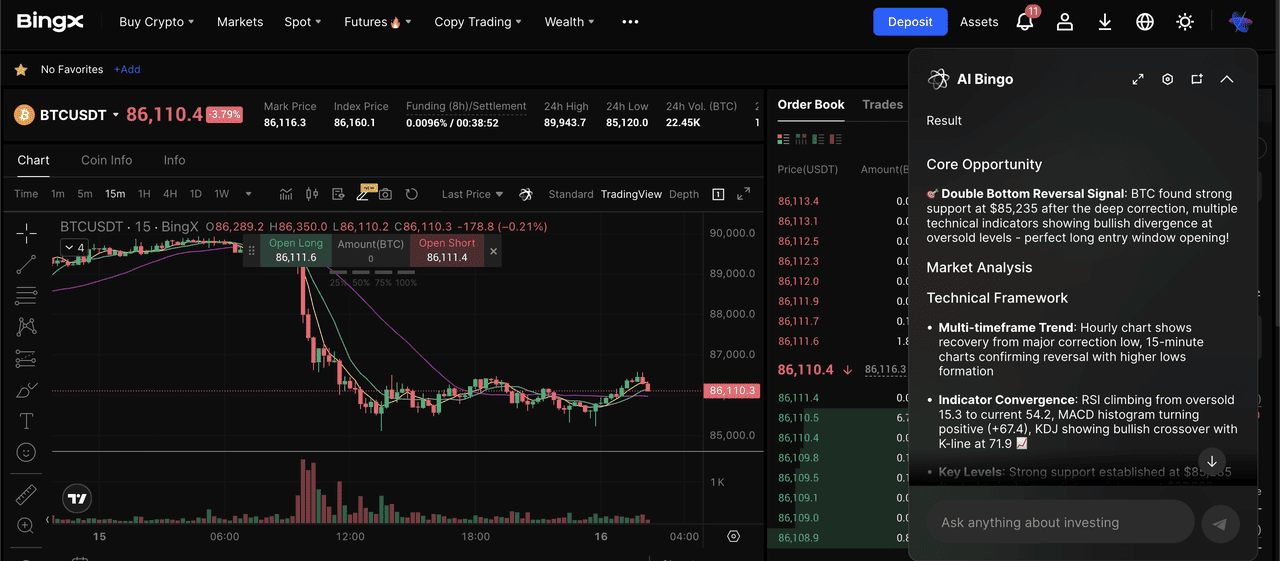
BTC/USDT perpetual contract on the futures market powered by BingX AI
Step 1: Open USDT-M or COIN-M BTC Futures on BingX.
Step 2: Choose your direction:
• Long if you expect BTC to rise.
• Short if you expect a correction or want to hedge your Spot holdings.
Step 3: Set low leverage (2x–5x) to manage risk during high volatility.
Step 4: Use Isolated Margin to prevent losses from impacting your entire futures balance.
Step 5: Place stop-market orders below invalidation points, such as key moving averages or support levels, to avoid liquidation spirals.
Step 6: If hedging, size your short position to offset a portion of your Spot exposure, not necessarily 100%.
4. Use Copy Trading for a Hands-Off Bitcoin Strategy
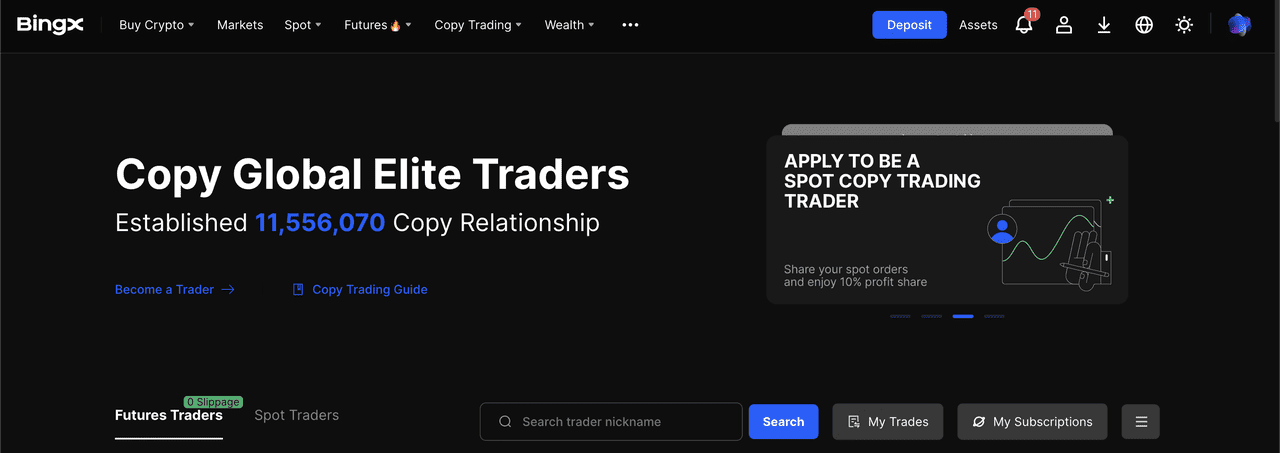
BingX copy trading
Step 1: Go to Copy Trading on BingX.
Step 2: Filter traders by performance, drawdown, win rate, and BTC trading strategy.
Step 3: Select traders who specialize in range trading, swing trading, or volatility trading.
Step 4: Allocate a portion of your capital and set copy limits, stop-loss levels, and per-trade caps.
Step 5: Monitor performance periodically and adjust your copied traders as market conditions change.
5. Use Trading Bots for Automated BTC Strategies
i. Grid Bot for Sideways Markets
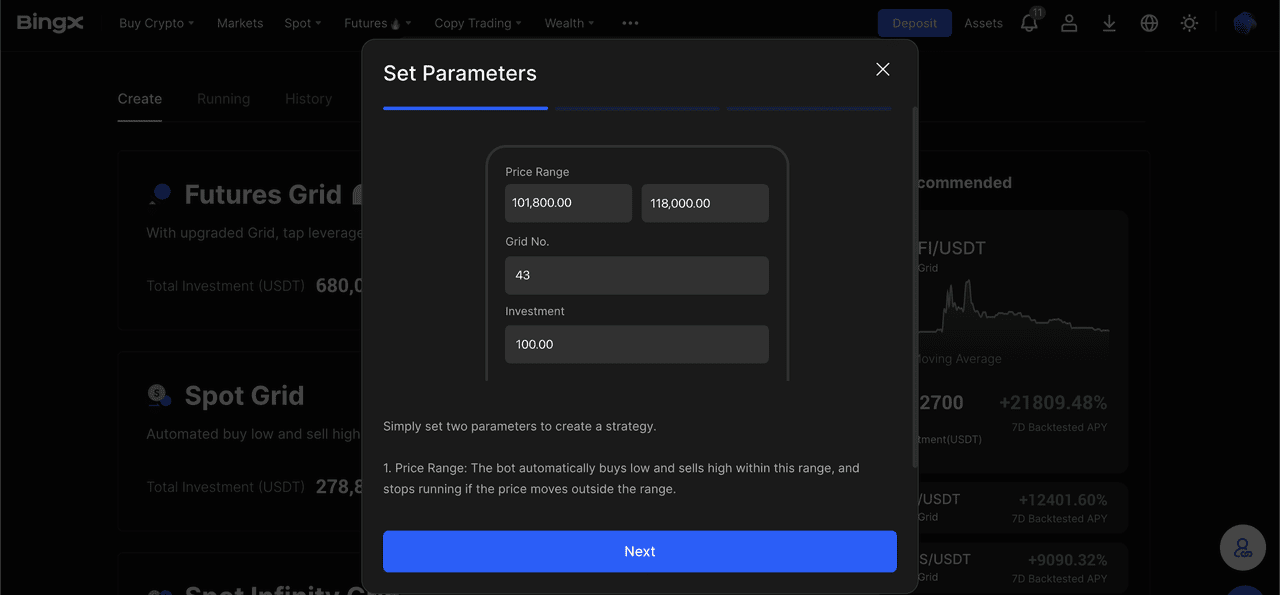
Configuring a spot grid trading bot on BingX
Step 1: Open Wealth, Earn, and select Strategy.
Step 2: Set a price range, e.g., $70,000–$110,000, that matches current BTC consolidation zones.
Step 3: Let the bot automate “buy low, sell high” cycles as BTC oscillates within the range.
ii. Spot Infinity Bot for Uptrending Markets
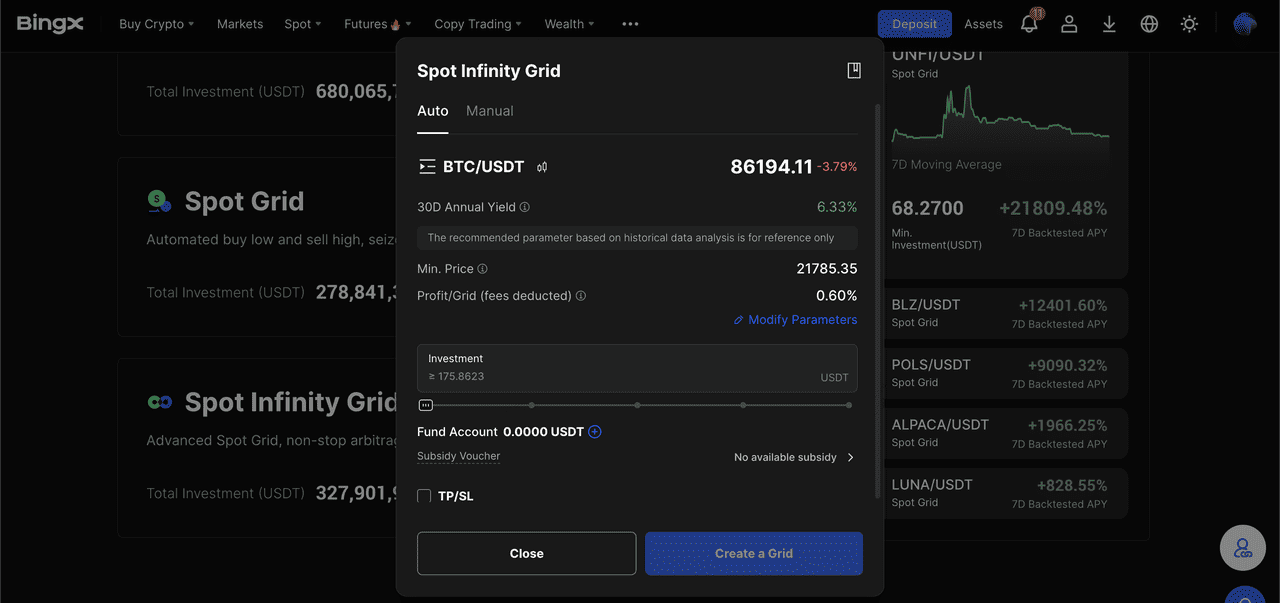
Configuring the spot infinity trading bot on BingX
Step 1: Choose Spot Infinity Bot for trending conditions.
Step 2: Set parameters so the bot automatically shifts your price bands upward as BTC makes higher highs.
Step 3: Allow the bot to compound profits while you avoid manually adjusting entries.
Top 7 Risk Management Strategies for Trading Bitcoin Volatility in 2026
Bitcoin in 2026 will likely move fast in both directions, so having a simple, practical risk plan is more important than having a perfect prediction. Here are the most effective ways to protect your capital while still staying active in the Bitcoin market.
1. Risk Only a Small Portion of Your Capital per Trade: Keep each BTC trade to 1–2% of your total portfolio. This prevents a single bad move, or sudden liquidation, from wiping out your account during sharp swings.
2. Set Stop-Loss and Take-Profit Levels Before Entering: Always decide your maximum loss and target profit ahead of time.
• A stop-loss closes your trade automatically if BTC breaks your invalidation zone.
• A take-profit locks in gains so you don’t give back profits during sudden reversals.
3. Use Leverage Carefully (or Avoid It Altogether): If trading futures, stick to low leverage of 2x–5x. Higher leverage may seem attractive, but it magnifies volatility and increases the risk of liquidation during routine price wicks.
4. Protect Spot Holdings With Hedging (Optional): If you hold BTC long-term but fear a drawdown, open a small short futures position to offset part of the downside. This stabilizes your portfolio without selling your spot BTC.
5. Monitor Market-Moving Events Closely: Volatility in 2026 will often come from external catalysts. Keep alerts on for:
• Fed interest rate decisions
• Regulatory announcements from US, EU, and Asia
• ETF inflows and outflows
• Major macro data like inflation, GDP, employment
These events can trigger sharp moves within minutes.
6. Avoid Emotional Trading and FOMO: Have a plan and stick to it. Don’t chase pumps, revenge trade losses, or trigger manual exits based on fear. Discipline protects your capital more than any indicator.
7. Review Your Positions Weekly: Use a simple routine: check whether your trades still fit the market structure, update stop-loss levels, and adjust for new ETF or macro data.
By applying these basic rules, you’ll stay flexible and better prepared to navigate both the bullish surges and bearish resets that 2026 may bring.
Conclusion: Is 2026 a Bull or Bear Market for Bitcoin?
Institutional research still points to a structurally bullish long-term trajectory, with several major forecasts projecting new all-time highs across 2026–2027. But medium-term data tells a more cautious story: on-chain models like MVRV, long-term holder profitability, and key moving averages all warn that Bitcoin could experience extended drawdowns or bear-style volatility before any sustained recovery. In today’s market, halving alone no longer dictates the cycle; ETF flows, digital-asset treasury behavior, macro liquidity, and regulatory clarity now share equal influence in shaping price direction.
For BingX traders, the actionable takeaway is to treat 2026 as a high-volatility transition year rather than commit to a single bull or bear narrative. Build flexible playbooks for multiple scenarios, focus on position sizing, use stop-loss and take-profit levels, and monitor ETF flow trends and macro events closely. The goal is not to predict the exact path, but to stay adaptable and manage risk effectively as Bitcoin navigates a more complex, institution-driven cycle.
Related Reading
FAQs: Bitcoin Bull vs. Bear Market in 2026
1. Is Bitcoin more likely to be in a bull or bear market in 2026?
Data points both ways. Grayscale, Bernstein, and major banks expect higher prices and potential ATHs in 2026, while on-chain models like the MVRV spread warn that a deep bear-style correction could last into late 2026.
2. Does the 2024 Bitcoin halving guarantee a bull run in 2026?
No. The halving reduces new supply and has historically preceded bull runs, but in the ETF era, macro conditions and institutional flows significantly influence outcomes. Halving is a tailwind, not a guarantee.
3. What price targets do major institutions have for Bitcoin in 2026?
Revised forecasts cluster around $120,000–$150,000: Standard Chartered and Bernstein now both target about $150,000 for 2026, with Bernstein seeing a potential $200,000 peak in 2027 and $1 million by 2033.
4. Could Bitcoin drop to $40,000–$50,000 in 2026?
Some on-chain and technical analysts see $40,000–$80,000 as potential downside zones in a worst-case bear reset, especially if ETF outflows and macro shocks align. These are scenarios, not certainties, but they highlight why risk management is essential.
5. How should I trade Bitcoin during such uncertainty?
Consider combining DCA on spot, tightly risk-managed futures for hedging or directional views, Copy Trading and bots for range markets, and strict stop-loss/position-sizing rules. The aim is to participate in upside while surviving extended volatility.
6. How often should I revisit my 2026 Bitcoin outlook?
Reassess at least monthly, and more frequently around major macro events like central-bank meetings, regulatory votes and large ETF flow shifts. In a fast-changing institutional market, static forecasts age quickly.
7. When Will Bitcoin Reach $1 Million?
Most long-term models don’t expect Bitcoin to reach $1 million this cycle, but several institutional forecasts point to that level being possible over the next decade. Bernstein projects a path to $1 million by 2033, supported by ETF adoption and shrinking supply. Still, these targets are speculative and depend heavily on macro conditions and sustained institutional demand.
