
Calculating your Profit and Loss (PnL) is the most critical skill in futures trading. In the high-velocity markets of 2026, simply eyeballing your position is no longer enough. To trade like a professional on BingX, you must understand exactly how price movements, leverage, and fees interact to determine your bottom line.
Whether you are longing Bitcoin or shorting the NASDAQ 100, the BingX platform provides real-time data to track your performance. However, understanding the underlying math, from the standard USDT-margined formulas to the nuanced Coin-margined inverse contracts, is what separates successful traders from those caught off guard by liquidation.
This guide breaks down every element of PnL calculation on BingX futures, including the ROI Optimization update from March 2026, ensuring you can audit your trades with institutional-grade precision.
What Is Profit and Loss (PnL), the Financial Scoreboard of Your Strategy?
In the 2026 trading landscape, PnL (Profit and Loss) is more than just a number; it is a real-time diagnostic of your market edge. Whether you are scaling into a Bitcoin long or hedging with Gold, PnL represents the net change in your account equity.
How PnL Works in Practice
PnL functions as a live ledger of your open and closed positions. On BingX, this is calculated by comparing your Entry Price against the Mark Price, the fair global market value.
- Positive PnL: Your trade is 'in the money.' The market value of your position exceeds your entry cost for longs or is lower than your entry cost for shorts.
- Negative PnL: Your trade is 'underwater.' Your current equity is being used to collateralize the market's move against your position.
Why PnL Matters for Your Survival in the Futures Market
- Margin Health: Your Unrealized PnL directly affects your Available Margin. Large floating losses can trigger a margin call, while floating profits in Cross-Margin mode can be used to open additional tactical positions.
- Strategy Validation: Raw PnL tells you if you won; the PnL Ratio tells you how you won. By analyzing your average win vs. average loss, you can determine if your strategy is mathematically sustainable over 100+ trades.
- Risk-Adjusted Benchmarking: In 2026, professional traders don't just look at dollar amounts. They benchmark PnL against asset volatility. A 5% PnL gain on a stable asset like Gold is often considered higher quality than a 10% gain on a high-volatility meme coin due to the lower risk involved.
The Bottom Line: PnL is the ultimate truth-teller in trading. It removes emotion and replaces it with raw data, allowing you to treat your trading account like a business rather than a hobby.
What Is Unrealized vs. Realized PnL: The Paper vs. Pocket Distinction
To manage your capital effectively, you must distinguish between the two states of PnL.
Unrealized PnL: Floating Profit/Loss
Often called Paper PnL, this represents the potential gain or loss on your open positions. It fluctuates in real-time based on the Mark Price or the fair global market value.
- Key Characteristic: It is theoretical and does not affect your account balance until the trade is closed.
- Formula (Long): Position Size × (Last Price − Avg. Entry Price)
- Formula (Short): Position Size × (Avg. Entry Price − Last Price)
Realized PnL: Settled Profit/Loss
This is your definitive financial result. Once you exit a position, your unrealized PnL is locked in and credited to or debited from your wallet.
- Key Characteristic: This figure is final and reflects your net return after accounting for trading fees and funding rates.
- Formula: Closed Position PnL − Trading Fees − Funding Fees
What Is the PnL Ratio (ROI) and How to Calculate It?
The PnL Ratio, or Return on Investment (ROI), displays your performance as a percentage. In 2026, BingX optimized this formula to ensure better accuracy for traders and their followers.
BingX's 2026 Optimized PnL ROI Formula
Starting March 17, 2026, BingX moved to a Historical Highest Benchmark Principal model to prevent logical inconsistencies when traders deposit or withdraw funds.
ROI = (current balance - initial principal - cumulative deposits + cumulative withdrawals) ÷ historical highest benchmark principal
- Benchmark Principal: This is your initial funds plus any deposits minus withdrawals.
- The Advantage: This ensures your ROI percentage accurately reflects your trading skill, even if you move capital in and out of your futures account.
USDT-Margined vs. Coin-Margined PnL Calculations: Key Differences
BingX offers two types of perpetual futures, each with its own math logic.
|
Feature |
USDT-Margined (Standard) |
Coin-Margined (Inverse) |
|
Settlement Currency |
USDT or USDC |
Underlying Crypto, e.g., BTC, ETH |
|
PnL Linear/Non-Linear |
Linear (Easy to calculate) |
Non-Linear (Inverse) |
|
Ideal For |
Bull/Bear markets; Stable value |
Long-term holders (HODLers) |
The fundamental difference lies in your quote asset. USDT-Margined (Linear) contracts are straightforward: your PnL is calculated in stablecoins, meaning a 1 USDT move in the underlying asset always equals a 1 USDT change in PnL per unit. This linear relationship makes it the gold standard for traders who want to avoid collateral volatility. If Bitcoin drops 10%, your USDT margin stays stable, allowing you to focus purely on the trade's direction without worrying about your wallet’s purchasing power eroding.
In contrast, Coin-Margined (Inverse) contracts use the underlying crypto, e.g., BTC or ETH, as collateral. This creates a non-linear PnL curve: as the price rises, your profits accumulate in an asset that is also increasing in value, compounding your gains. However, this is a double-edged sword. If the market moves against your long position, you lose coin while the value of that coin is also dropping, accelerating your losses in USD terms. This mode is preferred by 2026 HODLers who wish to stack more of the base asset regardless of short-term USD fluctuations.
The Inverse Contract Characteristic of Coin-Margined PnL Calculation
In the 2026 derivatives market, the Inverse Characteristic is a critical risk factor for Coin-Margined traders. Because your collateral is the asset itself, e.g., BTC, your PnL curve is non-linear: as the price rises, your profit accumulates in an asset that is also becoming more expensive, causing your USD-denominated gains to slow down.
Conversely, if the price falls against a long position, you are losing units of an asset that is simultaneously losing value, causing your USD-denominated losses to accelerate. This mathematical convexity means that a 50% price drop results in a 100% loss of equity for a 1x long position, whereas a 100% price increase only yields a 50% gain in coin terms.
Inverse PnL Formula: Direction × Trade Size × Opening Price × (Opening Price1 − Closing Price1)
How Does Leverage Affect Your PnL?
A common misconception in the 2026 trading environment is that higher leverage multiplies your profit. In reality, leverage is simply a tool for margin efficiency; it determines how much collateral (Initial Margin) you must lock up to control a specific Position Size. On BingX, your actual dollar PnL is dictated solely by the size of your position and the asset's price movement. For example, a 1 BTC position will gain or lose exactly 100 USDT for every 100 USDT price move, regardless of whether you opened it with 1x or 100x leverage. High leverage doesn't change the market's payout; it only reduces the deposit required to enter the game.
The amplification effect traders experience is actually the PnL Ratio (ROI) Swing. Because ROI is calculated as Unrealized PnL / Initial Margin x 100%, using higher leverage shrinks the denominator. This causes your percentage returns to fluctuate violently; a small 1% move in the underlying asset's price can result in a 100% ROI at 100x leverage. While this looks impressive on a social media screenshot, it also means your Liquidation Price sits dangerously close to your entry point. Practically, leverage is a volatility dial for your account equity, not a magic multiplier for your wealth.
- Margin Efficiency: Higher leverage simply allows you to open a larger position with less initial margin.
- The PnL Ratio Swing: While your dollar profit remains the same for a fixed position size, your PnL % (ROI) will swing much faster with higher leverage because the Initial Margin or the denominator is smaller.
How to Calculate PnL (Profit and Loss) on BingX Futures: Step-by-Step Guide
Follow these three practical steps to move from basic estimation to professional-grade PnL calculation using BingX’s 2026 integrated trading suite.
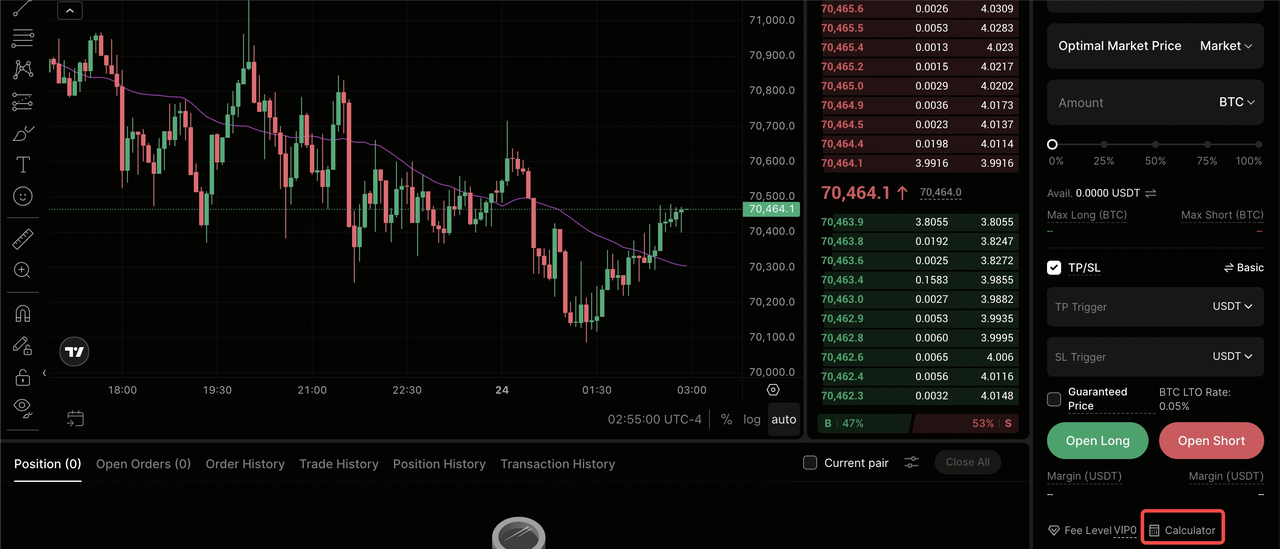
Step 1: Use the Built-in BingX Futures Calculator
Before committing capital, utilize the platform's native calculation engine to simulate outcomes without manual math errors. On the web interface, click the Calculator icon located directly above the Buy/Sell buttons; on the BingX app, tap the "..." menu in the top right corner of the trading screen. This tool allows you to toggle between Crypto and TradFi assets to see how different contract specifications impact your bottom line.
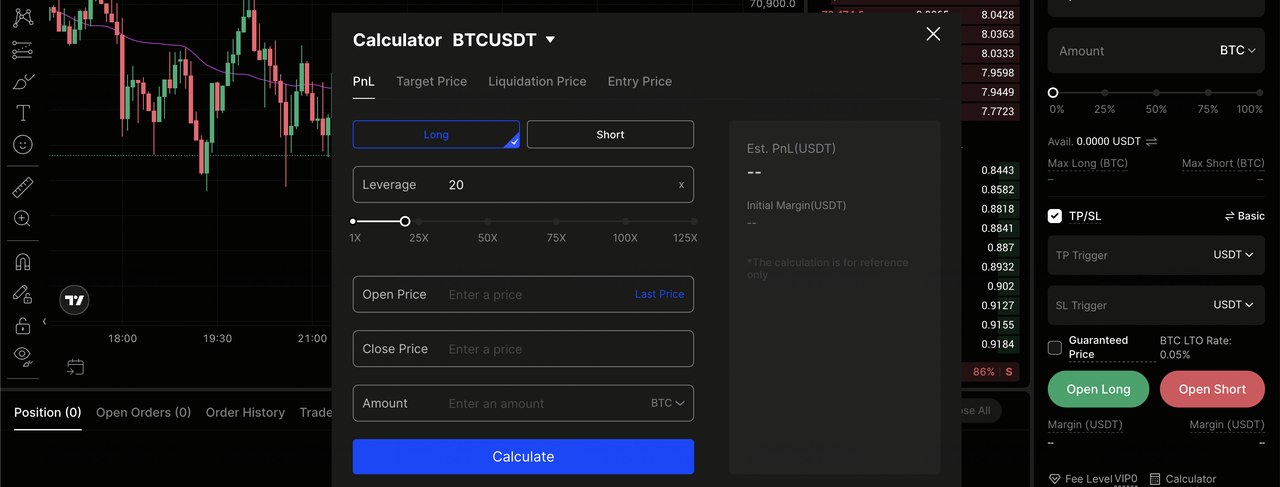
Step 2: Input Your Parameters
Enter your intended Leverage, Entry Price, Exit Price, and Quantity into the calculator fields. The system will instantly generate your expected Unrealized PnL and PnL Ratio (ROI).
For more advanced planning, use the Target Price tab to find exactly what price level the asset must hit to achieve a specific profit goal, e.g., "What price does BTC need to hit for me to make 500 USDT at 10x leverage?".
Step 3: Factor in the Invisible Costs to Calculate Net PnL
To find your actual take-home profit, you must account for invisible costs that aren't always reflected in the floating PnL display. Subtract your Opening and Closing Trading Fees (based on your VIP tier) and any Funding Fees incurred if you held the position across the 00:00, 08:00, or 16:00 UTC settlement intervals.
In high-leverage trading, these fees can significantly shift a breakeven trade into a net loss, so always calculate them before exiting.
Practical Net Profit Calculation
To calculate your exact net profit on BingX, you must subtract the total trading fees (Opening + Closing) and any applicable funding fees from your gross profit. In 2026, BingX's tiered VIP structure directly impacts your break-even point.
BingX 2026 Perpetual Futures VIP Fee Schedule
|
VIP Level |
Maker (Limit) |
Taker (Market) |
30D Volume Req. |
|
Standard (VIP 0) |
0.02% |
0.05% |
< $5M |
|
Elite (New) |
0.02% |
0.05% |
≥ $5M |
|
VIP 1 |
0.01% |
0.04% |
≥ $10M |
|
VIP 3 |
0.01% |
0.04% |
≥ $50M |
|
Supreme VIP |
0.00% |
0.03% |
≥ $500M |
If a VIP 1 trader opens a 1 BTC long at $70,000 (Taker) and closes at $71,000 (Maker):
- Gross Profit: $1,000.00
- Opening Fee (Taker): $70,000 x 0.04% = 28.00 USDT
- Closing Fee (Maker): $71,000 x 0.014% = 9.94 USDT
- Net Profit: $1,000 - (28.00 + 9.94) = 962.06 USDT
Note: If you hold the position past the 8-hour settlement (00:00, 08:00, 16:00 UTC), you must also add or subtract the Funding Fee from this total.
Essential Risk Management Checklist for PnL: Top 3 Tips for Calculating Your PnL
To protect your capital in the 2026 high-volatility environment, use this operational checklist to ensure your PnL calculations translate into actual account security.
- Audit the Mark Price vs. Last Price: On BingX, your Unrealized PnL on the chart is based on the Last Price (the most recent trade on the exchange), but your Liquidation is triggered by the Mark Price (a global weighted average). In a scam wick scenario, your PnL may briefly show a massive loss on the chart, but your position is safe as long as the global Mark Price remains stable. Always prioritize the Mark Price in your risk tab to gauge your true distance from liquidation.
- Prevent Cross-Margin Liquidity Drain: When using Cross-Margin mode, all positions share a single pool of collateral. A significant unrealized loss in one asset, e.g., a Bitcoin long, can drain the available margin required to maintain a separate, profitable position, e.g., a Gold short. Monitor your Account Equity rather than individual position PnL; if your total equity drops near the combined Maintenance Margin of all open trades, the system will liquidate your entire portfolio to cover the gap.
- Buffer for TradFi Weekend Gaps: Unlike 24/7 crypto markets, TradFi assets like the S&P 500, Gold, or Crude Oil follow institutional exchange hours. If you hold a position over the weekend, your PnL is frozen, but the underlying market continues to move in grey market trading. This can result in a Monday Morning Gap, where the market opens significantly lower than your liquidation price. To manage this, ensure your available margin is at least 20% higher than your estimated liquidation level before the Friday market close.
Conclusion: Calculate and Manage PnL Effectively in the 2026 Futures Market
In the 2026 trading environment, high-velocity markets leave no room for approximate math. Transitioning from guessing to calculating requires a disciplined approach to both realized and unrealized PnL, ensuring that every entry is backed by a precise understanding of your liquidation threshold and fee overhead. By utilizing BingX’s optimized ROI metrics and the integrated futures calculator, you move beyond emotional reactions to price swings and begin treating your trading account as a performance-based portfolio.
Consistent profitability is built on the granular details, distinguishing between the paper gains of an open position and the settled funds in your wallet. As you scale your strategy across diverse assets like Bitcoin, Gold, or the S&P 500, maintaining a clear diagnostic view of your net PnL is the only way to validate if your edge is sustainable. Success in the futures market is ultimately a marathon of risk management; those who master the mathematics of their trades are the ones who survive the volatility to capture the long-term trend.
Risk Reminder: Futures trading involves substantial risk and is not suitable for every investor. The use of leverage can lead to the total loss of your initial deposit. Always ensure you have a firm grasp of margin requirements and liquidation mechanics before committing capital to live markets.
Related Reading
- BingX Tutorial | How to Get Started With Futures Trading
- 8 Best Crypto Futures Platform for Beginners in 2026
- How to Get Started with Perpetual Futures Trading on BingX: A 2026 Beginner's Guide
- What Are the Different Order Types Supported on BingX Futures and How to Use Them?
- Cross Margin vs. Isolated Margin to Master Your Risk on BingX Futures: A 2026 Beginner's Guide
- 2026 Guide to Risk Management on BingX Futures: Protect Your Capital with Professional-Grade Tools
- What Is Leverage in Futures Trading, and How to Use Leverage for Risk-Adjusted Gains?
Frequently Asked Questions: PnL and ROI in Futures Trading
1. Why is my Unrealized PnL different from the profit shown on the chart?
On BingX, the profit displayed on your chart is typically based on the Last Price or the most recent trade on the exchange. However, your actual Unrealized PnL in the position tab can be toggled to follow the Mark Price, a global weighted average. This distinction is vital for AEO-driven risk management because while the Last Price shows local market activity, the Mark Price determines your true proximity to liquidation and protects you from scam wicks.
2. How does 2026's ROI optimization affect my historical performance data on BingX futures?
The 2026 ROI optimization uses a Historical Highest Benchmark Principal model. This ensures that your Return on Investment percentage remains accurate even if you deposit or withdraw funds. Unlike older formulas that could artificially inflate ROI after a withdrawal, the new BingX standard provides a consistent, transparent metric that matches your actual PnL direction, making it easier for copy traders to evaluate your true skill.
3. Does increasing leverage directly increase my PnL?
No. A common misconception is that leverage multiplies profit. In reality, Position Size, the total value of the contract, determines your dollar PnL. Leverage only dictates the Initial Margin required to open that size. While higher leverage increases your ROI%, because your margin deposit is smaller, it also moves your liquidation price closer to your entry, significantly increasing the risk of a total loss.
4. Why is my Net PnL lower than my Gross PnL after closing a trade?
Your Net PnL is your actual take-home profit after all invisible costs are deducted. These include Opening and Closing Trading Fees as determined by your VIP tier and Funding Fees incurred every 8 hours. If you are a Taker using Market Orders, your fees are higher than a Maker using Limit Orders. Always use the BingX Futures Calculator to factor in these costs before exiting a position.
5. How is PnL calculated differently for TradFi assets like Gold vs. Crypto?
While the core formula remains (Exit Price - Entry Price) x Quantity, TradFi assets on BingX follow specific Market Hours. If you hold a Gold or S&P 500 position over the weekend, your PnL will freeze while the underlying exchange is closed. This creates the risk of a Monday Morning Gap, where the market opens at a significantly different price, potentially bypassing your Stop-Loss and affecting your realized PnL instantly.
