

Ever felt like Bitcoin’s rally was losing steam? Or noticed Ethereum’s sharp drop slowing down, candle by candle?
These moments often hint at a potential trend reversal, and that’s where candlestick patterns like the Morning Star and Evening Star become essential tools for crypto traders.
These classic three-candle formations can help you:
• Spot the end of an uptrend or downtrend
• Identify a shift in market momentum
• Make better entry and exit decisions based on price action
Let’s break down how each pattern works, starting with the Morning Star, and explore how to trade them in real crypto markets.
What Is the Morning Star Pattern?
The Morning Star is a bullish reversal candlestick pattern that typically appears at the bottom of a downtrend. It signals that bearish momentum may be fading, and a new upward trend could be about to begin.
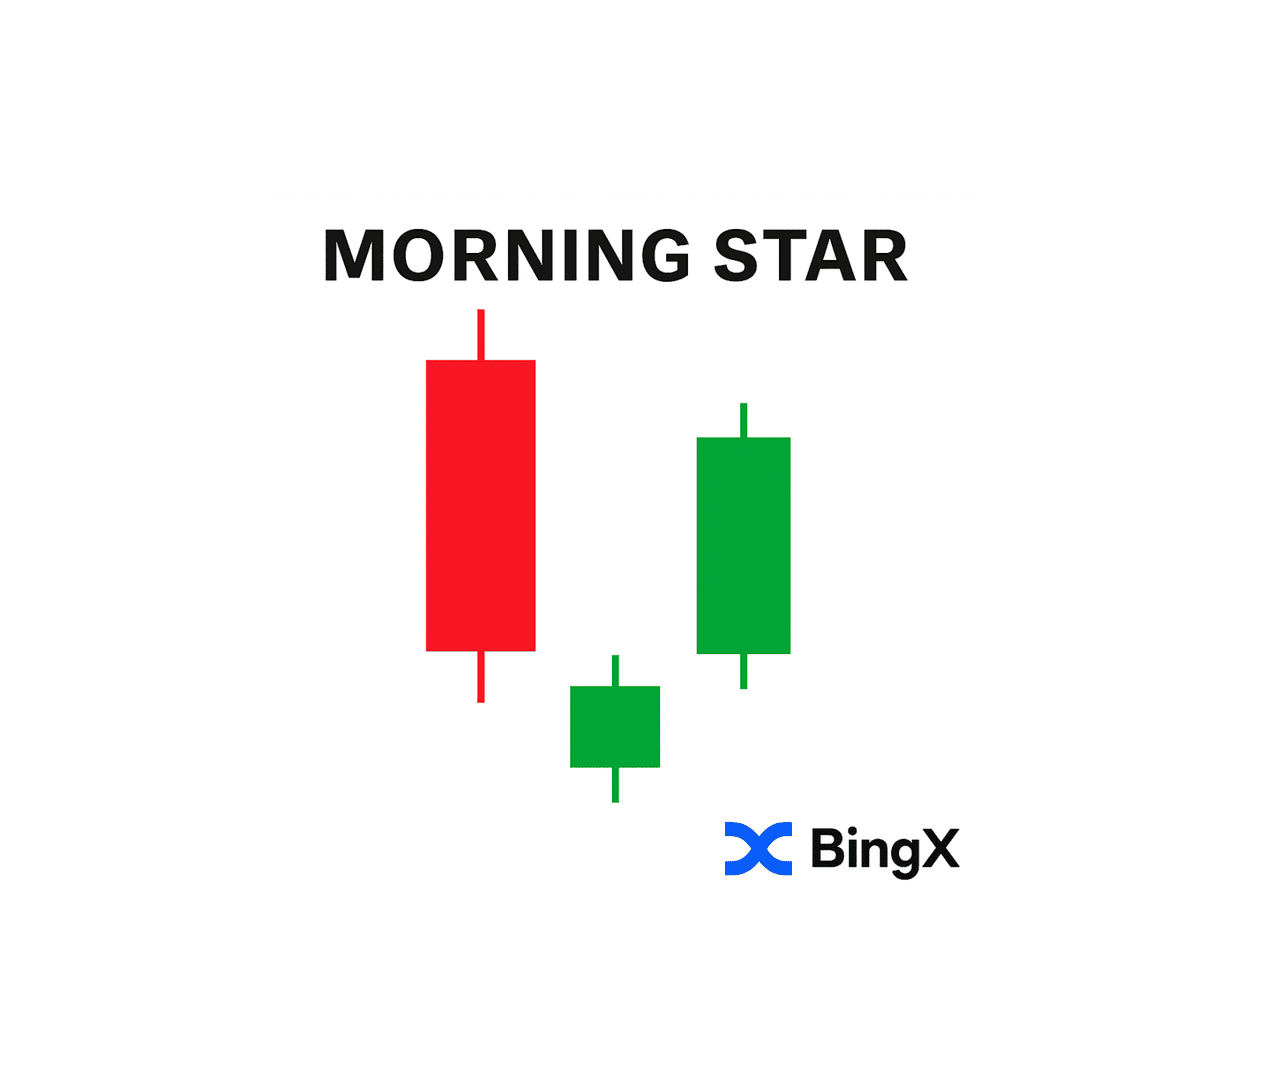
This pattern is made up of three candles:
• First Candle: A long red (bearish) candle showing intense selling pressure
• Second Candle: A small-bodied candle (green, red, or doji) showing market indecision
• Third Candle: A strong green (bullish) candle that closes well into the body of the first red candle
This sequence tells a story:
• Sellers dominate during the first candle
• Indecision sets in during the second
• Buyers return with force in the third, confirming a shift in momentum
In crypto trading, spotting this pattern, especially near key support levels, can help you catch early signs of a bullish trend reversal.
How to Identify a Morning Star Pattern
The Morning Star is a bullish three-candle reversal pattern that forms after a clear downtrend. The first candle is a long red candle showing strong selling. The second candle is small-bodied (a doji or spinning top), indicating market hesitation. The third candle is a large green candle that closes above the midpoint of the first, confirming renewed buying pressure.
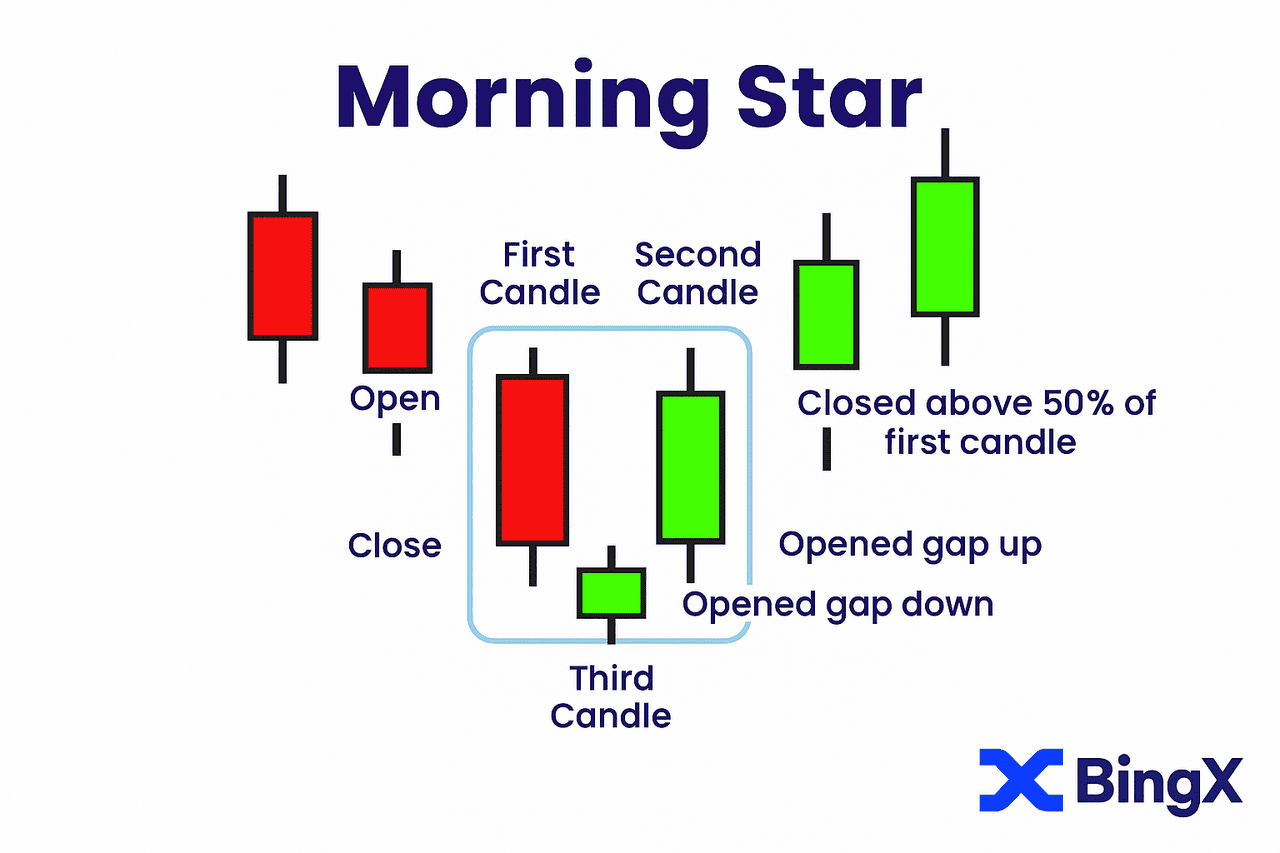
To strengthen the setup, traders look for:
• A well-defined downtrend leading into the pattern
• A small or indecisive middle candle
• Final candle closing firmly above the first
• Rising volume on the third candle
• Pattern forming near a known support zone
These elements suggest a potential shift from bearish momentum to bullish intent, especially when confirmed with indicators or price structure.
How to Trade the Morning Star in Crypto
To reduce guesswork, it’s recommended to wait for the third candle to fully close before placing a trade. Once the pattern is complete, traders often open a long position and place a stop-loss below the lowest point of the middle candle. This provides a safety buffer in case the market fails to follow through.
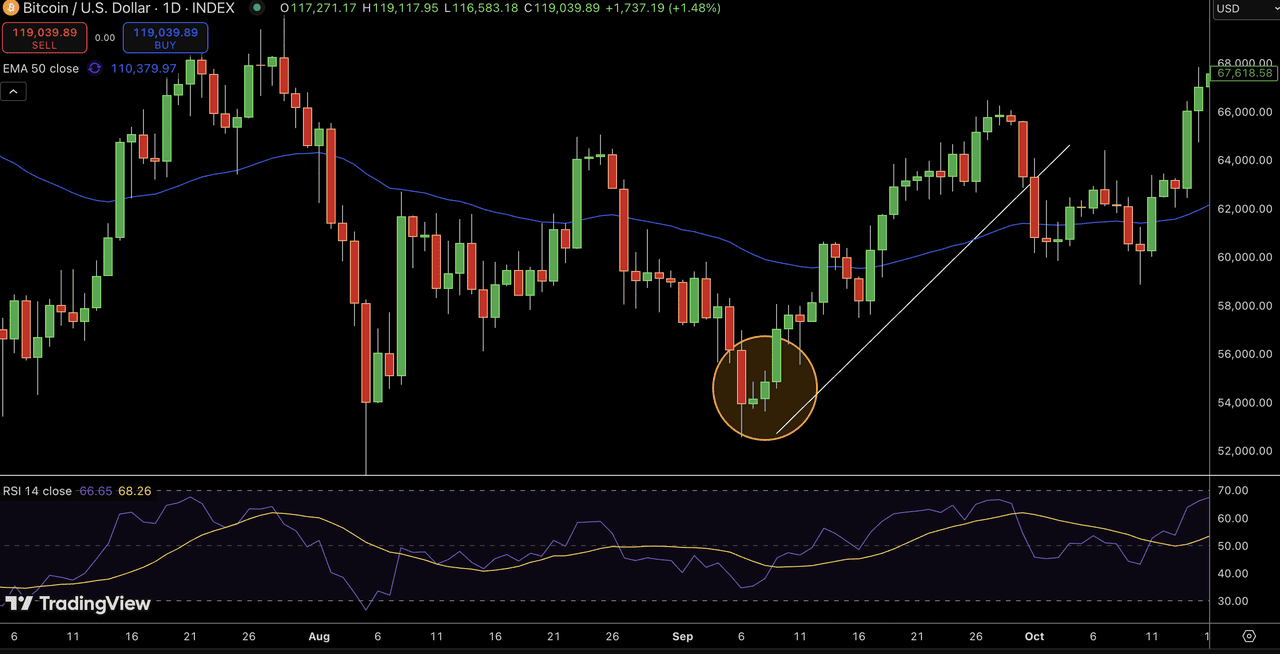
Source: BTC/USDT Trading Chart on BingX
Take-profit targets can be set near the next resistance level or based on a fixed risk-to-reward ratio, such as 1:2. While the pattern itself shows a shift in direction, many traders confirm their setups using technical indicators. If the Relative Strength Index (RSI) is below 30, suggesting the asset may be oversold, the conditions are more favorable for an upward move.
Additional confirmation tools include Bollinger Bands (especially if the price bounces from the lower band), moving average crossovers, and the Crypto Fear and Greed Index, particularly when it’s in the extreme fear range. These indicators help assess whether the price has the momentum to continue upward after the reversal begins.
Pros and Cons of the Morning Star Pattern
This pattern is straightforward to spot and effective in highlighting possible shifts in price direction.
Advantages:
• Easy to recognize on a chart
• More meaningful when it aligns with support and volume
• Can be applied to BTC, ETH, and other major pairs
Limitations:
• Entry happens after part of the move has occurred
• May not be effective without volume or RSI confirmation
• Less useful in sideways or low-momentum markets
What Is the Evening Star Pattern?
The Evening Star is a bearish reversal candlestick pattern that forms after an uptrend and signals a potential shift to downward momentum. It consists of three candles that, together, reflect a gradual loss of buying strength followed by renewed selling pressure.
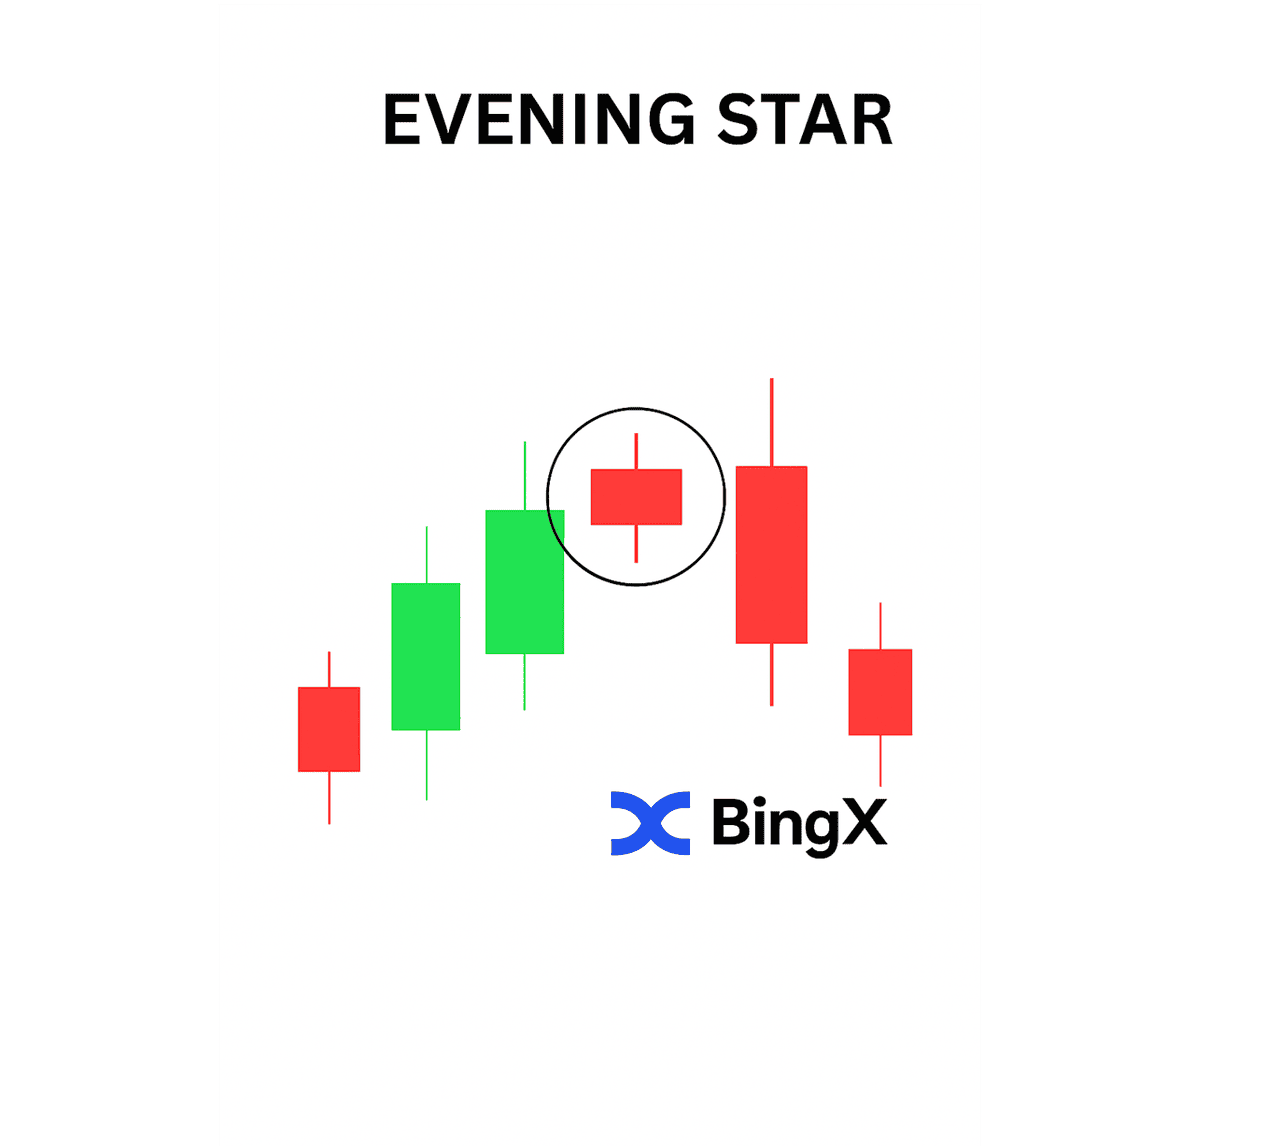
The first candle is a large green candle that confirms the strength of the current uptrend. A small-bodied candle follows it - this can be red, green, or a doji, which indicates hesitation. The third candle is a large red candle that closes well into the body of the first candle. This final move suggests that sellers are stepping in, taking control of the buyers.
This pattern highlights a loss of momentum in the prevailing trend. After buyers push prices higher, hesitation enters the market. If sellers then drive prices down significantly, it’s often an early sign that the uptrend has run its course.
How to Identify an Evening Star Pattern
The Evening Star is a bearish three-candle pattern that signals a potential reversal after an uptrend. It begins with a strong green candle reflecting sustained buying. The second candle is small-bodied (often a doji or spinning top), indicating indecision. The third is a large red candle that closes well into the body of the first, confirming a shift in momentum as sellers take control.
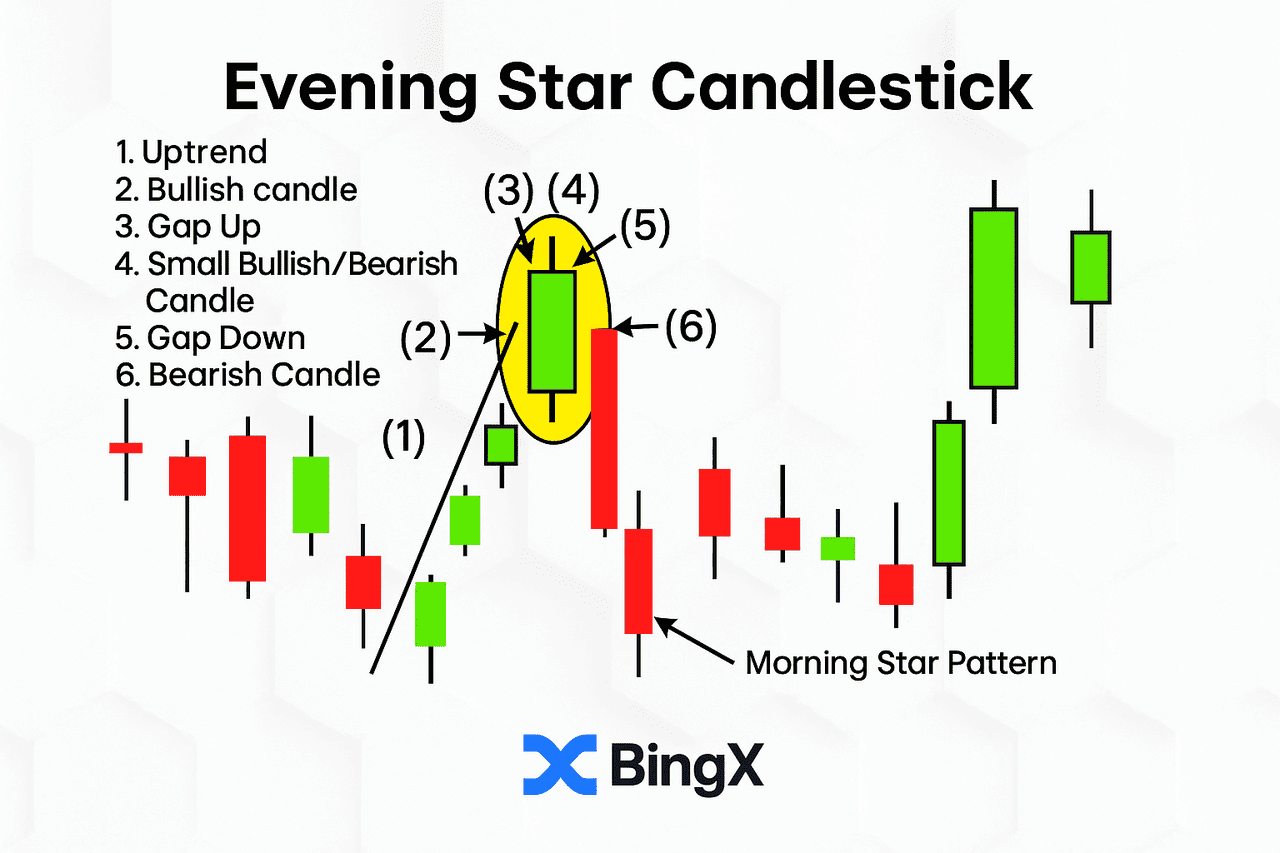
Supporting confirmation factors include:
• A doji or spinning top as the second candle (step 4)
• Gap up before and gap down after the middle candle (steps 3 and 5)
• Increased volume on the third candle (step 6)
• The pattern forming near a resistance level
The stronger the overlap and confluence, the more reliable the setup becomes—especially on higher timeframes.
How to Trade the Evening Star in Crypto
To act on the Evening Star pattern, traders typically wait for the third candle to close before opening a short position. This confirms that bearish momentum has taken hold. The stop-loss is usually placed above the high of the second candle or the entire pattern, depending on your risk tolerance.
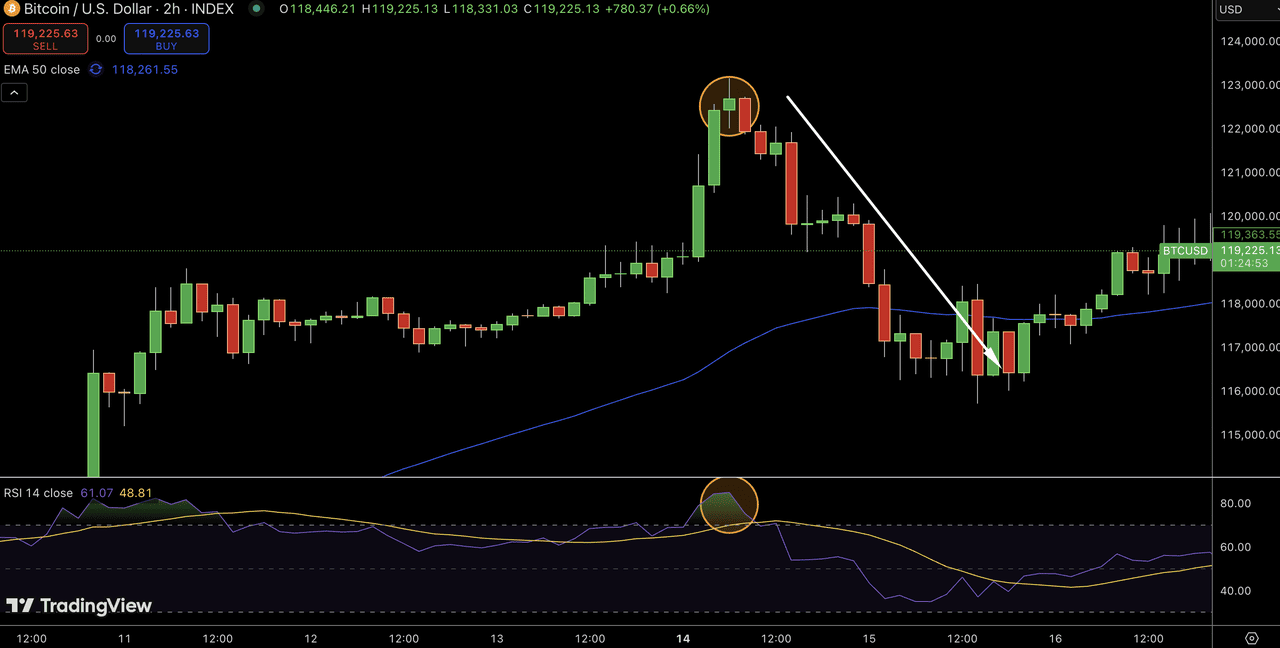
Source: BTC/USDT Trading Chart on BingX
Profit targets are often set near the next visible support level or structured using a fixed risk/reward ratio, such as 1:2. Traders also use the Relative Strength Index (RSI) to increase conviction. If the RSI is above 70, the market is considered overbought, which increases the likelihood that a reversal is sustainable.
The pattern’s reliability improves when used alongside:
• Bollinger Bands, particularly when the price touches or breaks the upper band
• EMA bearish crossovers (e.g., 9 EMA crossing below 21 EMA)
• Crypto Fear and Greed Index at extreme greed levels
Pros and Cons of the Evening Star Pattern
The Evening Star is useful for spotting potential market tops and taking profit before a reversal begins.
Benefits:
• Useful for recognizing shifts from bullish to bearish
• Helps anticipate pullbacks or trend reversals
• Enhanced by overbought RSI and resistance zones
Limitations:
• Requires confirmation to avoid early entries
• Less reliable in weak or low-volume uptrends
• Visual clarity can be reduced in crypto without price gaps
Morning Star vs. Evening Star: Key Differences
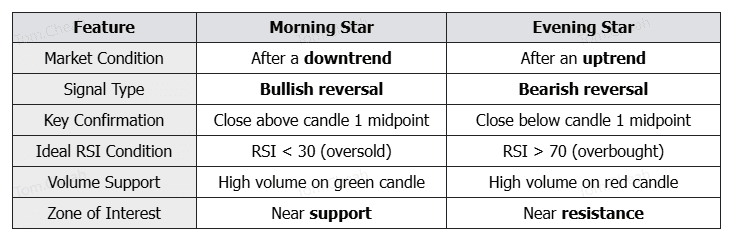
The Morning Star and Evening Star patterns are both critical reversal signals in crypto trading, but they operate under opposite market conditions. The Morning Star forms after a downtrend and signals a potential bullish reversal. It begins with a strong bearish candle, followed by a small-bodied candle showing indecision, and ends with a large bullish candle that closes above the midpoint of the first. This shift suggests buyers are regaining control, especially if the RSI is below 30 (oversold) and there’s high volume on the final green candle. Traders often watch for this pattern near key support levels, as it indicates that selling pressure is weakening and a price rebound could follow.
On the other hand, the Evening Star appears after an uptrend and signals a bearish reversal. It starts with a strong bullish candle, followed by a small indecisive candle, and finishes with a large bearish candle closing below the midpoint of the first. This pattern warns that buyers are losing momentum and sellers are taking over, particularly if the RSI is above 70 (overbought) and high volume accompanies the final red candle. Crypto traders typically look for the Evening Star near resistance zones, where price exhaustion and profit-taking often occur. In both cases, confirming signals from volume spikes, RSI extremes, or other technical indicators like moving average convergence divergence (MACD) can enhance the reliability of these setups in volatile crypto markets.
Hot Trading Tip
• Use Morning Star when a downtrend shows signs of stalling and buying strength returns
• Use Evening Star when an uptrend loses momentum and sellers start dominating
For best results, look for confirmation from volume, RSI, or moving averages. BingX AI can help you read these chart patterns and indicators in real time, making it easier to spot high-probability trade setups.
Conclusion
The Morning Star and Evening Star patterns provide practical insights into shifting momentum in cryptocurrency markets. These three-candle formations, one bullish, one bearish, help traders recognize turning points with clarity.
Used in conjunction with tools like RSI, Bollinger Bands, and volume analysis, these patterns become powerful setups for identifying trend reversals. Whether you're trading Bitcoin, Ethereum, or altcoins, identifying these signals early can help improve timing, reduce risk, and bring more structure to your decision-making on BingX.
Related Articles
FAQs on Morning Star and Evening Star Patterns
1. What is the difference between Morning Star and Evening Star chart patterns?
The Morning Star is a bullish reversal pattern that forms at the end of a downtrend, while the Evening Star is a bearish reversal pattern that appears after an uptrend. Both signal momentum shifts using three candlesticks.
2. How to confirm a valid Morning Star or Evening Star in crypto trading?
Confirmation comes from the third candle’s position and strength, rising volume, and alignment with key support or resistance zones. Indicators like RSI or Bollinger Bands add further confidence.
3. Can I use Morning Star and Evening Star patterns on all timeframes?
Yes, these patterns are effective across daily, 4-hour, and even shorter intraday charts. However, higher timeframes typically offer more reliable signals with reduced market noise.
4. Are Morning Star and Evening Star patterns reliable without technical indicators?
They can work on their own, but reliability improves significantly when paired with indicators like RSI, MACD, or moving averages, especially in volatile crypto markets.
5. How do I trade the Evening Star pattern using BingX charts?
Wait for the third bearish candle to close, enter a short trade, set a stop-loss above the pattern, and use support levels or a 1:2 risk/reward ratio to manage your target.