
Crypto prices rarely move in straight lines. They surge, stall, reverse, and form patterns that look chaotic, until you study them through Elliott Wave Theory. This method breaks price action into repeatable structures shaped by crowd psychology, giving traders a way to spot trends before they fully develop.
The theory works especially well in crypto because volatility makes impulsive and corrective waves easy to identify. When you understand how investors behave in each stage, fear, hesitation, acceleration, exhaustion, you start to see why markets turn when they do and why certain reversals happen exactly at key points.
Elliott Waves aren’t just about labeling patterns. They help traders recognize where momentum is building, where a trend is weakening, and where high-probability reversal zones may appear.
What Is Elliott Wave Theory and How Does It Work in Crypto Trading?
Elliott Wave Theory explains why markets move by showing that price follows recurring emotional cycles. Developed by Ralph Nelson Elliott in the late 1930s, the idea is simple: when human behavior repeats, market structure repeats.
At its core, the theory relies on two main building blocks:
• Five-wave movement in the direction of the trend
• Three-wave move against it.
Below is the standard Elliott Wave cycle you’ll see across crypto charts:
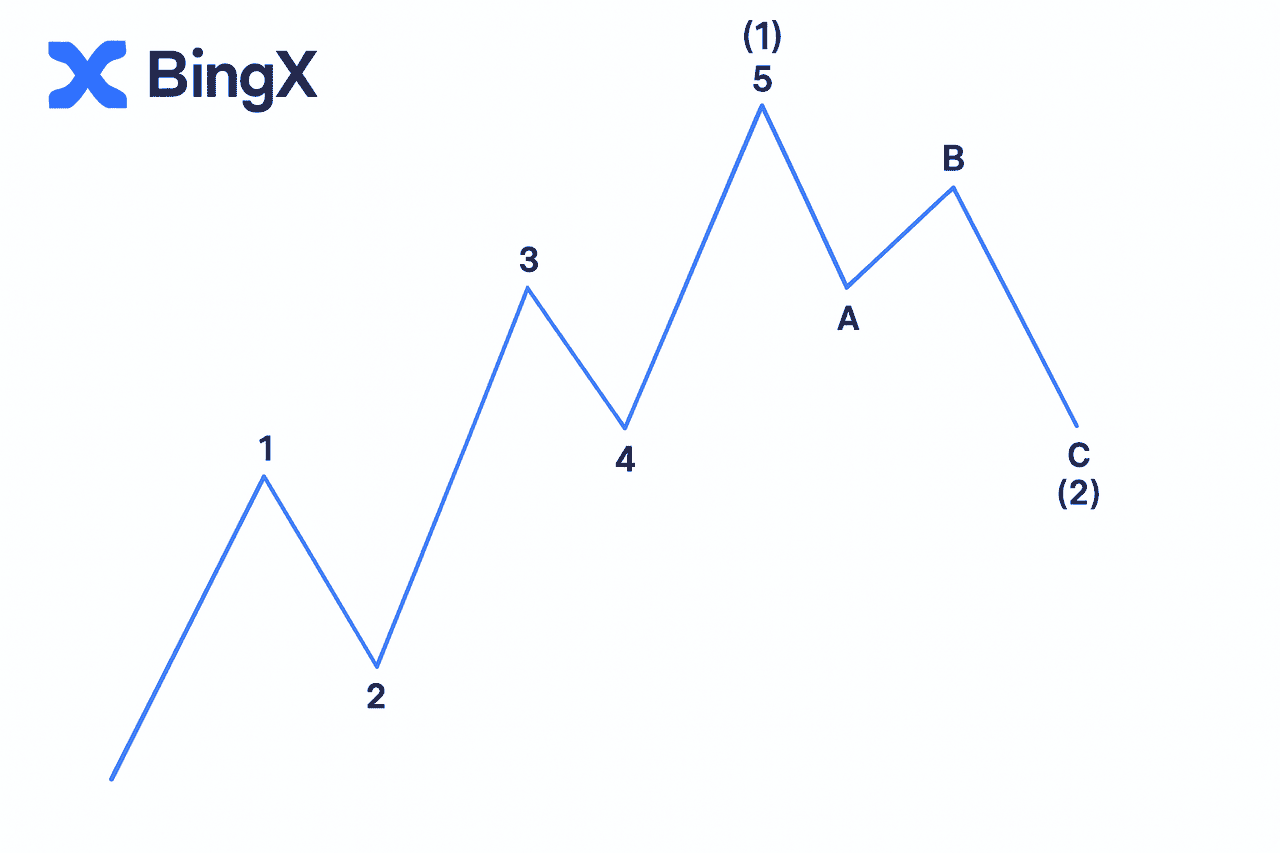
In this cycle:
• Waves 1, 3, 5 push price forward
• Waves 2 and 4 create pauses
• Waves A, B, C unwind the trend
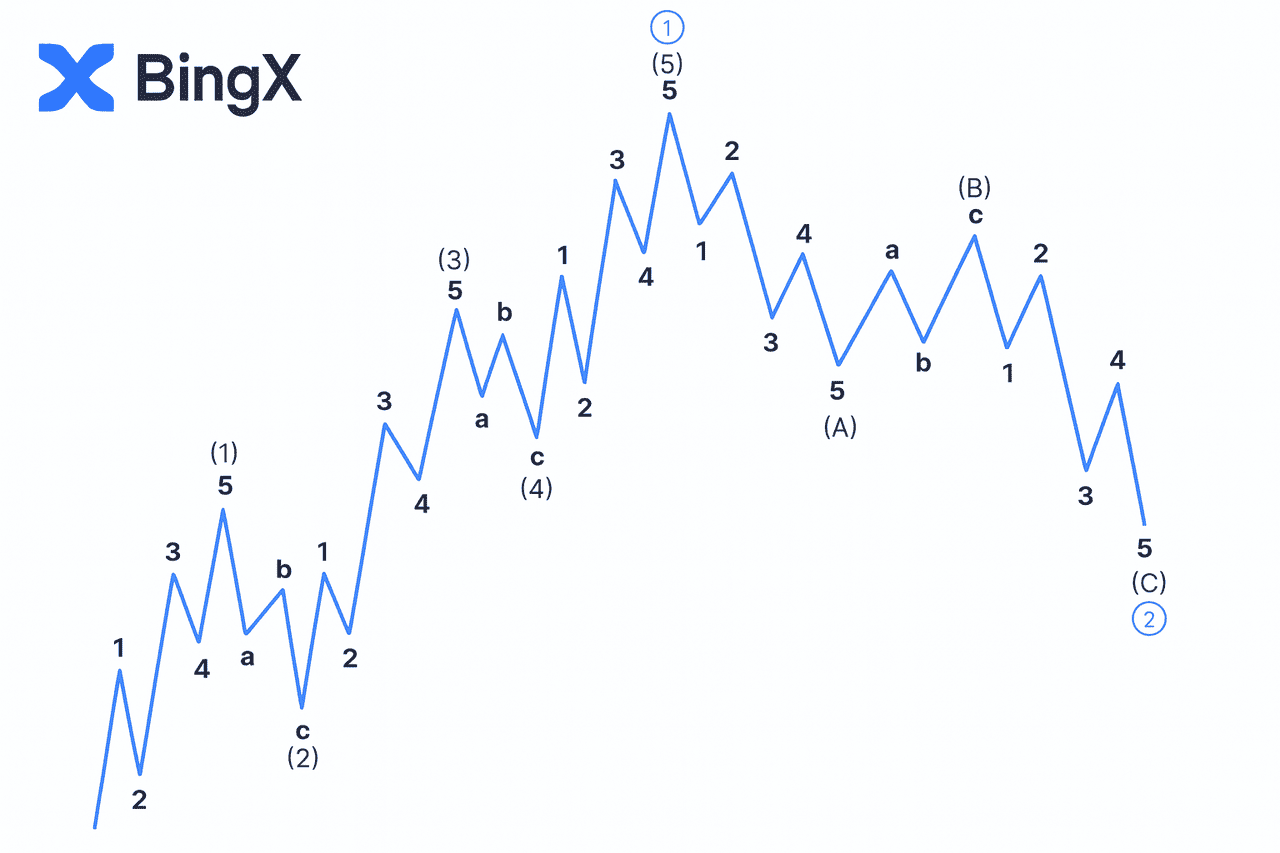
Because waves are fractal, smaller waves build into larger structures. A pattern on a one-minute chart can be part of a much bigger cycle on the hourly or daily timeframe. For traders, the key advantage is knowing where the market is inside this sequence. Wave 3 often signals strong acceleration; Wave C often signals exhaustion or reversal.
How to Identify Each Component of the Elliott Wave Structure
Elliott Wave Theory divides every market cycle into a five-wave motive phase and a three-wave corrective phase. Learning these eight waves makes it easier to read trend directions and anticipate shifts.
1. How to Recognize the Five-Wave Motive Phase
The motive phase is where the trend gains strength through a 5-wave impulsive structure. It includes Wave 1, Wave 3, and Wave 5 as the driving moves, with Wave 2 and Wave 4 acting as normal pullbacks.
Here’s what makes each impulsive wave unique:
• Wave 1 begins when early buyers react to a shift in sentiment. The move is usually modest but sets the direction.
• Wave 3 is almost always the strongest and longest impulsive wave. This is where broader participation enters, volume expands, and price accelerates.
• Wave 5 is the final push. Momentum is still positive, but psychology shifts, late traders jump in, and smart money starts preparing for a slowdown.
Across these motive waves, price typically moves with rising participation and clear directional flow, making them ideal spots for trend-following setups.
2. How to Spot the Three-Wave Corrective Phase
Once the motive wave completes, the market usually retraces through a three-wave pattern labeled Wave A, Wave B, and Wave C. This is known as the corrective phase, and it reflects a temporary break in the trend.
Here’s how the corrective structure unfolds:
• Wave A begins the pullback as traders lock in profits.
• Wave B is a short-lived rebound that often misleads newcomers into thinking the trend will continue.
• Wave C completes the correction, typically forming the deepest leg of decline.
Corrections can take several recognizable shapes, zigzags, flats, or triangles, but psychology remains consistent. Wave C often marks a potential reversal zone, giving traders an early signal that the main trend may resume soon.
How to Use Elliott Wave Analysis to Identify Crypto Trends
Elliott Wave analysis breaks market movement into impulsive and corrective structures, helping traders interpret price behavior instead of reacting to it. The goal is to maintain an accurate Elliott Wave count and apply the rules consistently so the pattern remains valid.
Once traders understand how these waves form and relate to each other, identifying trend direction and future price targets becomes much clearer, especially in volatile crypto markets.
How to Confirm Impulse Waves Using Elliott Wave Rules
An impulse wave drives the trend and appears in Wave 1, Wave 3, and Wave 5 of the motive phase. These are the waves that show strong momentum and set the direction of the trend.
To confirm a valid impulsive wave, Elliott Wave analysis relies on three core rules:
1. Wave 2 cannot retrace below the start of Wave 1
2. Wave 3 cannot be the shortest of Waves 1, 3, and 5
3. Wave 4 cannot enter Wave 1’s price zone
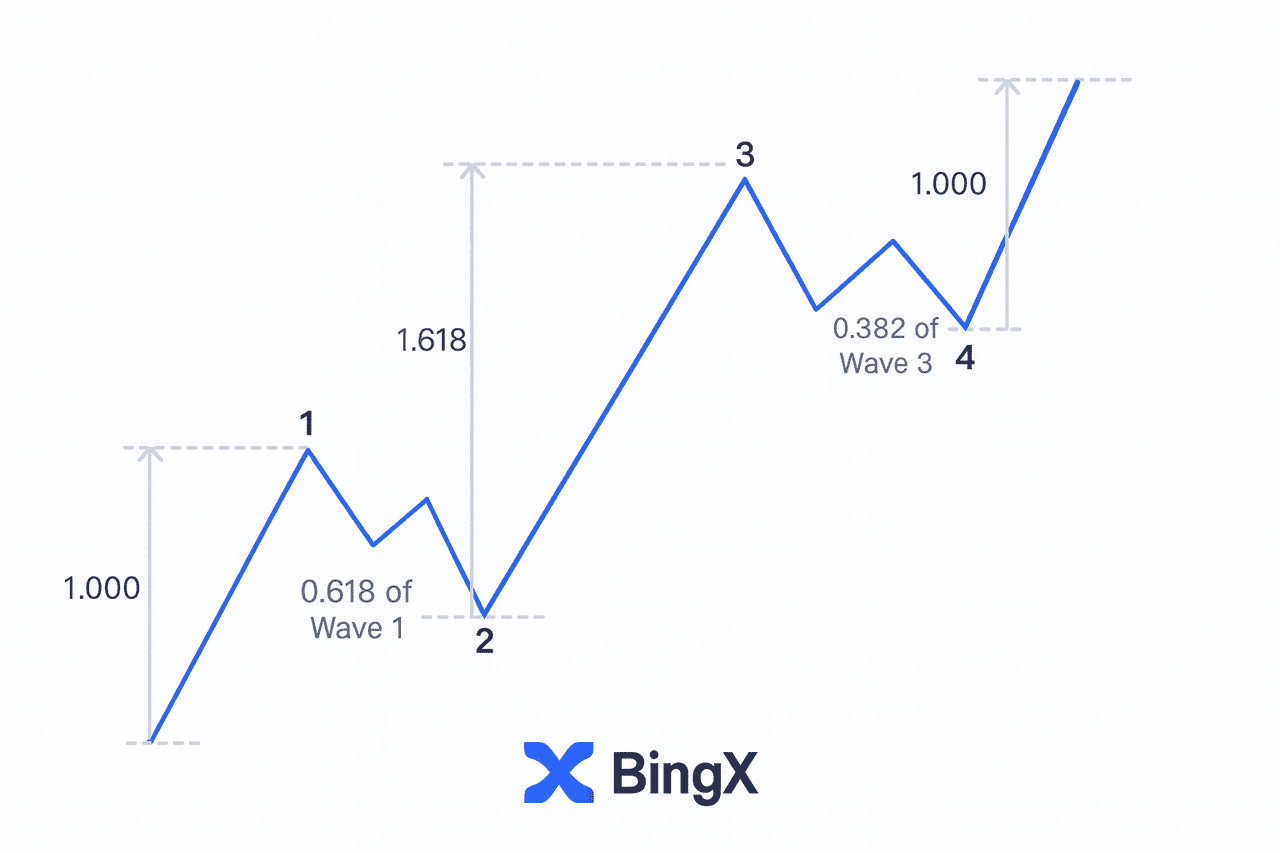
Crypto traders use Fibonacci tools to measure each leg.
• Corrective waves are measured with retracements
• Impulsive waves use extensions to project targets
For example, Wave 2 often retraces around 0.618, Wave 3 commonly reaches the 1.618 extension, and Wave 4 tends to be shallow, pulling back near the 0.382 level. When Wave 3 is the longest, Waves 1 and 5 typically mirror each other in length.
How to Analyze Corrective Waves Using Elliott Wave Patterns
Corrective waves help traders identify likely support and resistance zones during pullbacks. While crypto corrections can be unpredictable, the Elliott Wave structure still provides clarity.

The three main corrective patterns are ZigZag, the Flat correction, and the Triangle.
• A ZigZag is a sharp ABC pattern (5-3-5) often seen in Wave 2.
• A flat correction follows a 3-3-5 structure, usually forming sideways in Wave 4.
• The Triangle is a five-leg consolidation (ABCDE) often appearing in Wave 4 or Wave B.
More complex corrections like WXY or WXYXZ combine multiple structures and create extended sideways ranges, typically within Wave 4.
Corrective highlights
• ZigZag is aggressive and often appears early in the trend
• Flats and triangles usually form later and move sideways
This structure gives traders a reliable framework for mapping market behavior, even when crypto price action becomes chaotic.
How to Trade Elliott Wave Setups in Crypto: Real BTC/USDT Example
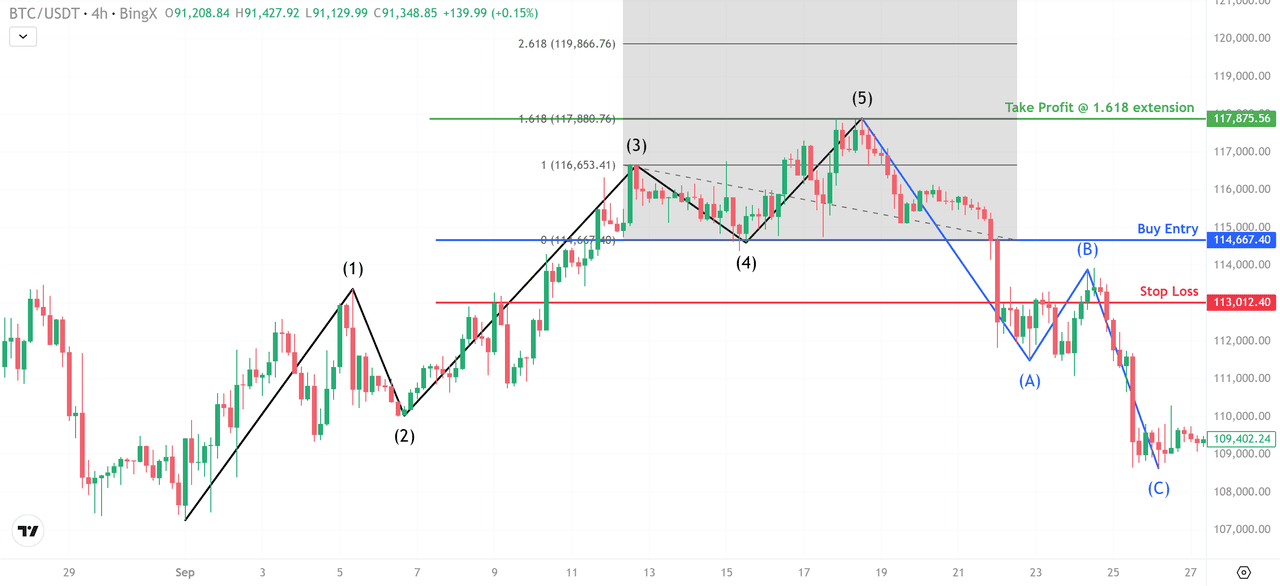
The BTC/USDT structure shows a complete five-wave motive phase followed by an A–B–C correction, creating clear trading opportunities for both trend-following and reversal strategies. Below are the setups traders could have executed using standard Elliott Wave rules.
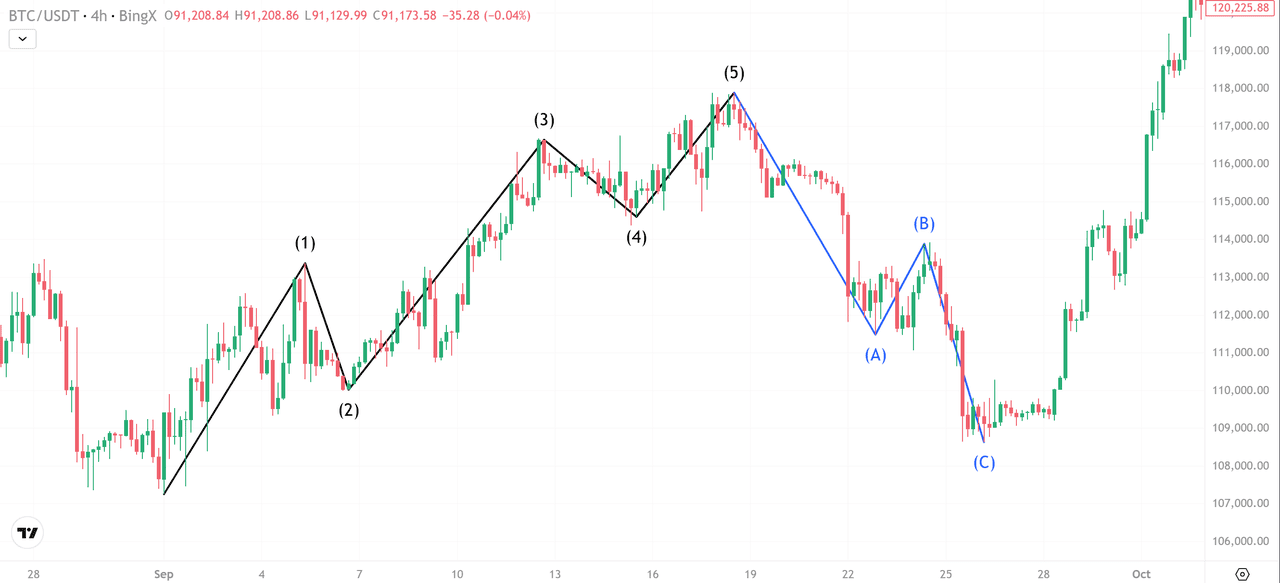
Bitcoin (BTC/USD) Price Chart - Source: BingX
1. How to Enter After Wave (2) Pullback
Wave (2) retracements often produce the lowest-risk entry before the strongest phase of the trend. In this case, BTC/USDT pulled back to the 0.618 Fibonacci zone, stabilizing near $110,950 and offering an ideal long entry.

Bitcoin (BTC/USD) Price Chart - Source: BingX
Once price held above this level, buying pressure returned and price accelerated into Wave (3). Traders could trail stops or scale profits as the market broke above the Wave (1) high and extended toward the 1.618 Fibonacci target at $115,379.
Key Levels:
• Entry: $110,950 (Wave 2 pullback / 0.618 zone)
• Stop-Loss: $109,040 (below Wave 2 low)
• Targets: $113,317 to $115,379 (1.618 extension) to Wave (3) peak
2. How to Trade Wave (4) Consolidation for a Wave (5) Breakout
Wave (4) typically forms a mild corrective structure before the final push into Wave (5). BTC/USDT dipped into the 0.236–0.382 retracement of Wave (3), consolidating around $114,667.
Bitcoin (BTC/USD) Price Chart - Source: BingX
This provided a clear continuation entry with risk defined below the Wave (4) low at $113,012. Once the consolidation broke, price moved into Wave (5), aligning with the 1.618 extension near $117,875.
Key Levels:
• Entry: $114,667 (Wave 4 pullback / 0.236–0.382 zone)
• Stop-Loss: $113,012 (below Wave 4 low)
• Targets: Wave (1) projected length to Wave (5) peak ($117,875 at 1.618 extension)
3. How to Short the Market After a Wave (5) Exhaustion
Wave (5) often shows fading momentum, making it a common reversal zone. In this chart, BTC stalled near $117,799 and printed rejection candles, indicating buyer exhaustion.

Bitcoin (BTC/USD) Price Chart - Source: BingX
A short entry here, with a stop loss of above $119,097, allowed traders to capture the full A–B–C decline. Price broke through Wave (4) support and continued directly to Wave (C) completion near $111,051.
Key Levels:
• Entry: $117,799 (Wave 5 rejection zone)
• Stop-Loss: $119,097 (just above Wave 5 high)
• Targets: Wave (4) low to Wave (A) low to Wave (C) completion ($111,051)
4. How to Trade the Wave (A) to Wave (B) Countertrend Bounce
Short-term traders can also trade the corrective bounce. Wave (A) formed support near $111,051, creating an intraday exhaustion low. A long entry here targets the typical 38–62% retracement of Wave (A), which aligned with $113,598. Stops are placed below the Wave (A) low at $110,135 to keep risk contained.
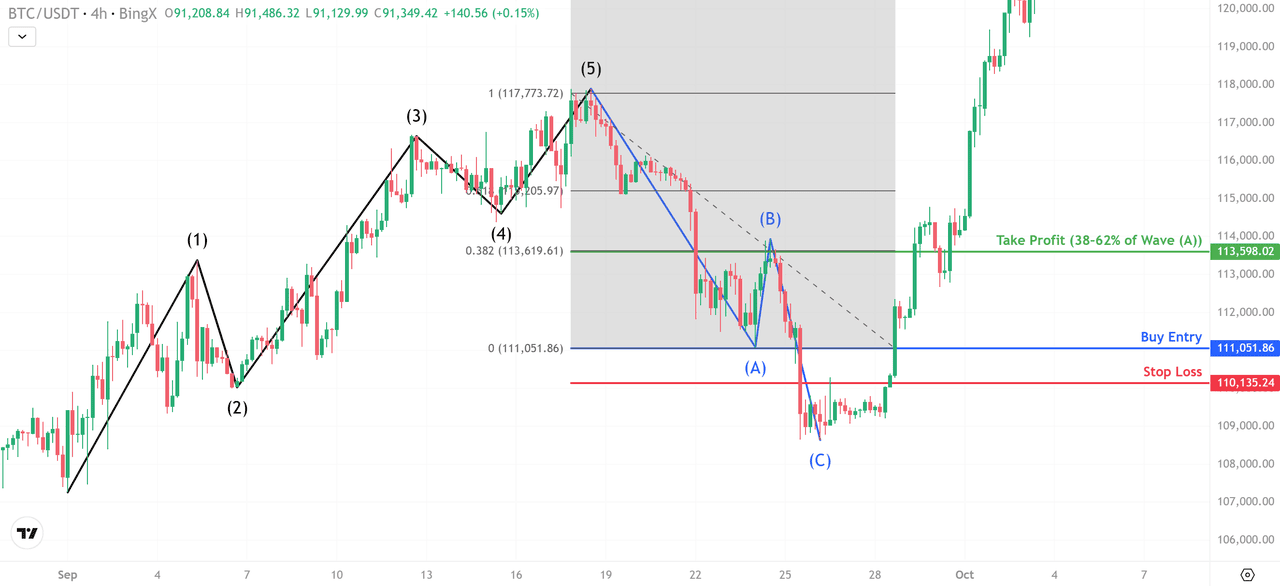
Bitcoin (BTC/USD) Price Chart - Source: BingX
Key Levels:
• Entry: $111,051 (Wave A support / exhaustion zone)
• Stop-Loss: $110,135 (below Wave A low)
• Take Profit: $113,598 (38–62% Wave A retracement to Wave B peak)
5. How to Catch the Best Reversal at the Bottom of Wave (C)
Wave (C) usually completes the correction and often produces the strongest reversal. BTC reached the 1.0–1.272 Fibonacci extension of Wave (A), bottoming near $109,167. Reversal signals such as long wicks, bullish candles, or Relative Strength Index (RSI) divergence confirmed seller exhaustion.
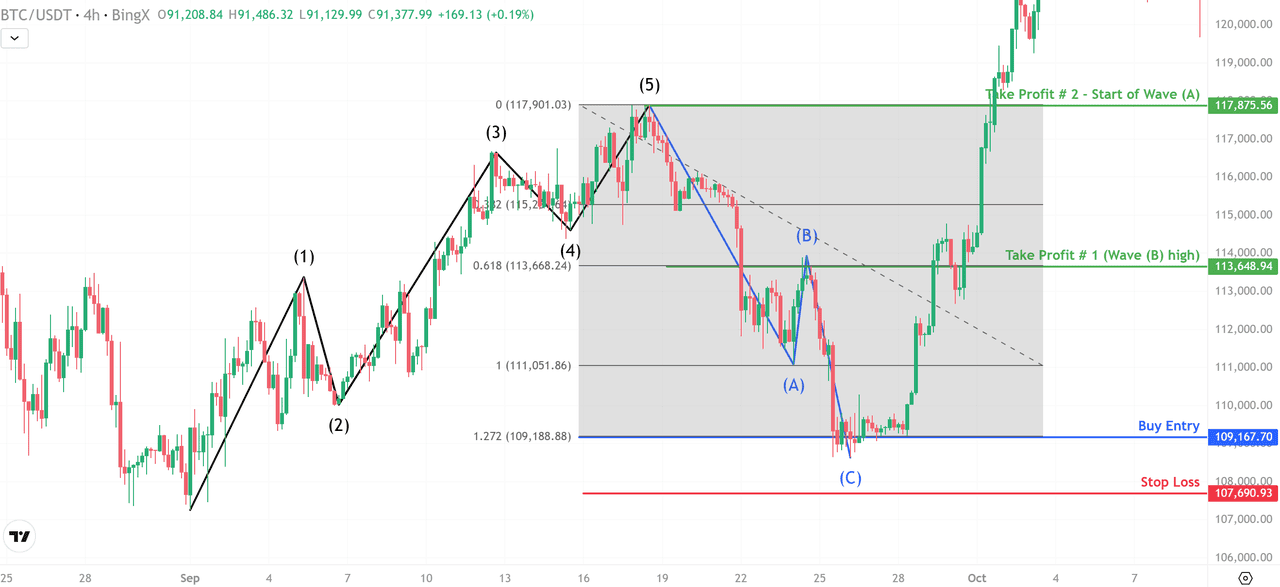
Bitcoin (BTC/USD) Price Chart - Source: BingX
A long entry above the Wave (C) low with a stop under $107,690 positioned traders for the next motive phase. Profit targets include the Wave (B) high at $113,648 and the start of Wave (A) near $117,875.
Key Levels:
• Entry: $109,167 (C-wave exhaustion zone)
• Stop-Loss: $107,690 (below Wave C low)
• Targets: Wave (B) high to start Wave (A) to next impulsive leg
What Are the Limitations of Elliott Wave Theory?
Elliott Wave analysis is useful, but it is not exact. Wave counts are highly subjective, which means two experienced analysts can look at the same chart and come up with different interpretations. This happens most often in choppy markets where impulsive and corrective waves overlap, making it difficult to mark a clean structure.
When to Use Alternative Technical Indicators Beyond Elliott Wave Theory
Because of this subjectivity, traders can easily fall into confirmation bias, forcing a wave count to support a bullish or bearish opinion. A practical approach is to treat every wave count as a working scenario, not a fixed prediction. If price breaks a key invalidation level, the count must be adjusted immediately.
In real trading, Elliott Waves work best when paired with other tools. Support and resistance, trendlines, RSI, or Fibonacci levels provide objective signals that help confirm whether a wave count is reliable. When waves become unclear, switching to simpler analysis methods often prevents costly mistakes.
Conclusion
Elliott Wave Theory gives traders a structured way to read market cycles instead of reacting to noise. By combining wave counts with Fibonacci levels and basic market psychology, it becomes easier to spot where trends may continue and where reversals are likely to form.
While no method is perfect, Elliott Waves help traders anticipate key turning points early and make more informed decisions in fast-moving crypto markets.
Related Articles
FAQs on Elliott Wave Theory in the Crypto Market
1. What is the main purpose of Elliott Wave Theory in crypto trading?
Elliott Wave Theory helps traders understand market structure by identifying impulsive and corrective waves. This allows traders to map trend direction and anticipate potential reversals earlier.
2. How do I know if my Elliott Wave count is correct?
A valid wave count follows three core rules: Wave 2 cannot break below Wave 1, Wave 3 cannot be the shortest, and Wave 4 cannot enter Wave 1 territory. If any rule breaks, the count must be adjusted.
3. Which indicators work best with Elliott Wave analysis?
The most useful tools are Fibonacci retracements and extensions, RSI divergence, trendlines, and volume patterns. These help confirm whether a wave structure is forming correctly.
4. Can Elliott Wave Theory work on smaller crypto timeframes?
Yes. Elliott Waves are fractal, meaning the same patterns appear on 1-minute, 1-hour, and daily charts. However, smaller timeframes can be more volatile and require faster decision-making.
5. What is the biggest limitation of Elliott Wave Theory in crypto?
The main limitation is its subjective nature. Different analysts may interpret wave structures differently, so it's important to treat wave counts as scenarios rather than fixed predictions.