
In late April 2026, the Russell 2000 (RTY) has emerged as the ultimate market outlier. While the S&P 500 and Nasdaq 100 grapple with a globally synchronized topping process and deteriorating breadth among the Magnificent Seven, the Russell 2000 has surged 12.25% year-to-date. On April 20, the index rose 0.3% even as conventional benchmarks fell, signaling a potential structural shift in leadership toward small-cap equities.
This decoupling is driven by a unique fundamental tailwind: the Federal Reserve’s aggressive pivot. With rate cuts in late 2025 and more projected for Q2 2026, the high concentration of floating-rate debt within the Russell 2000, once a liability, is becoming a primary engine for growth. However, with 40% of the index still comprising unprofitable companies and the CNN Fear and Greed Index hovering at 26 (Fear), the small-cap spring remains fragile.
This guide breaks down the Russell 2000 price prediction for 2026 using data from Fidelity, CoinCodex, and Gann Cycle analysis. You will also discover how to trade Russell 2000 futures through BingX TradFi.
Top 5 Things for Russell 2000 Investors to Know in 2026
As small-caps navigate a landscape of falling rates and global volatility, investors must track these five critical factors:
- The Rate Cut Catalyst: Small-caps are hypersensitive to the Fed. The projected rate cuts for Q2 2026 provide immediate relief to the interest expense of the index’s smaller, debt-heavy constituents.
- The Profitability Filter: Over 40% of the Russell 2000 is currently unprofitable. Investors are increasingly rotating into the S&P SmallCap 600, which requires positive earnings for inclusion, to mitigate volatility.
- Gann’s 60-Year Great Cycle: Market analysts point to 2026 as a mirror to 1966. This historical alignment suggests a period of intense volatility where traditional winners fail and niche industries lead.
- Domestic Insulation: Unlike the S&P 500, the Russell 2000 is less exposed to international geopolitical shocks in the Middle East and Europe, focusing instead on the resilient U.S. consumer.
- The 2,300 Technical Floor: The iShares Russell 2000 ETF (IWM) recently printed a lower low on its daily chart. Technical analysts warn that a failure to reclaim 2,400 could signal a Wave 4 correction toward much lower support levels.
What Is the Russell 2000 Index (RTY)?
The Russell 2000 is the most widely quoted benchmark for the bottom two-thirds of the Russell 3000 Index. It tracks approximately 2,000 small-cap companies with a median market cap significantly lower than those in the S&P 500.
In 2026, the index is a melting pot of disruptive sectors, including Renewable Energy, Quantum Computing, and Regional Banking. Key holdings like Bloom Energy, Credo Technology, and Echostar reflect the index's tilt toward the Agentic Web and DeFAI infrastructure. Because these firms rely on domestic credit markets, the Russell 2000 acts as a pure barometer for the health of the U.S. internal economy.
Russell 2000's Performance in 2025: A Review
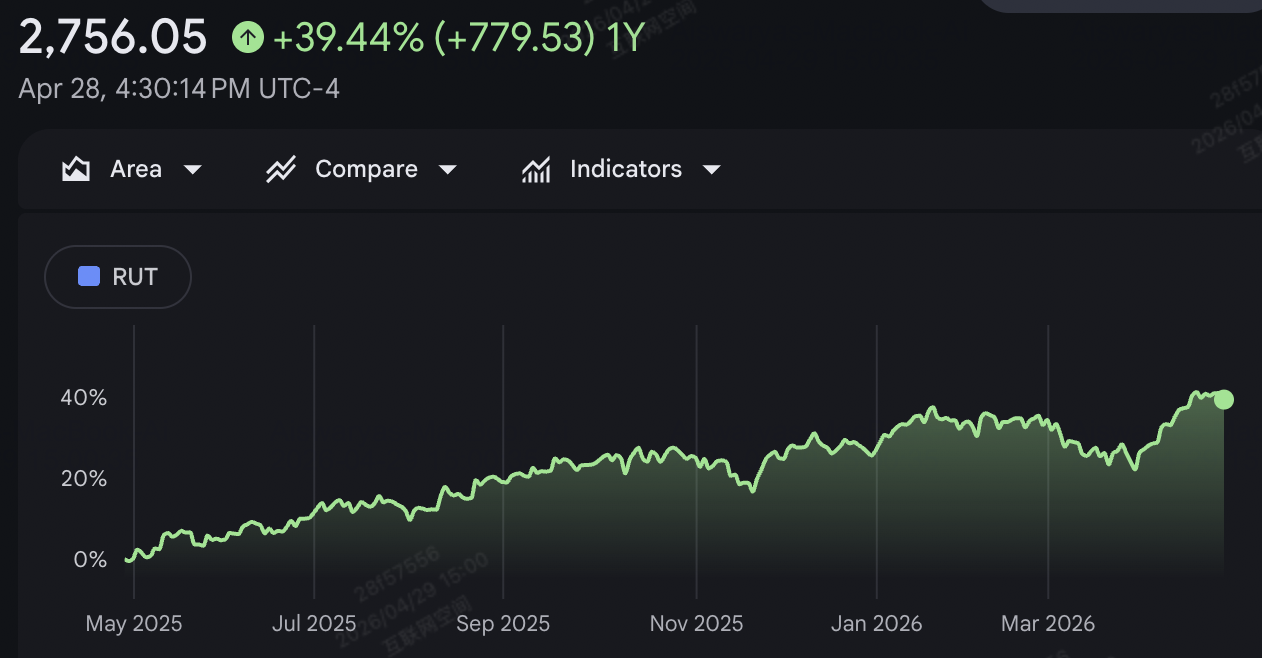
Russell 2000's performance: May 2025 - April 2026 | Source: Google Finance
2025 was a year of The Great Rebalancing. After underperforming for much of the AI-driven 2024 bull run, small-caps began their ascent in September 2025 following the Federal Reserve’s first rate cut. While large-caps struggled with high valuations, the Russell 2000 spent the latter half of 2025 expanding its base, finishing the year with a respectable 10% gain. This established the bottoming process that set the stage for the 12% surge seen in the first four months of 2026.
Russell 2000's 2026 Strategy: Navigating Small-Cap Volatility
- The Yield Sensitivity Play: As 10-year Treasury yields fluctuate near 4.5%, the Russell 2000 thrives whenever yields dip, as it lowers the cost of carry for niche growth industries.
- Sector Rotation: Financials and Industrials represent over 40% of the value-tilted side of the index. A strong U.S. labor market in 2026 is providing these sectors with a soft landing floor.
- RSI Divergence: Currently, the Relative Strength Index (RSI) for many small-caps is neutral near 49, suggesting that while the hype has cooled, the structural uptrend remains intact.
Russell 2000 2026 Investment Outlook: Bull Run vs. Correction
Understanding the potential trajectory of small-cap stocks requires balancing the optimistic macroeconomic tailwinds against the technical warnings of long-term market cycles.
The Bull Case: The 2,800 Small-Cap Spring
The bullish narrative assumes the Federal Reserve continues its cutting cycle through December 2026. In this Goldilocks scenario, falling borrowing costs revitalize the 40% of unprofitable small-caps, triggering a massive short squeeze and valuation re-rating. If the U.S. GDP remains above 2%, the Russell 2000 could decisively clear the 2,500 resistance and target a year-end milestone of 2,800.
The Base Case: 2,300 – 2,500 Range-Bound Grind
The base case sees the Russell 2000 digesting its recent gains. While rate cuts help, sticky inflation prevents the Fed from being as aggressive as the market hopes. In this environment, the index remains a stock-picker's market, where profitable small-caps outperform the broader index, leading to a year-end target of 2,450.
The Bear Case: The 2,100 Stagflation Trap
Russell 2000's bear case for 2026 hinges on a Wave 4 correction. If the globally synchronized topping process seen in the DAX and TSX spills over into U.S. credit markets, the Russell 2000 could face a liquidity crunch. A break below the 2,290 support level would likely activate systematic selling, pushing the index back toward the 2,100–2,150 zone.
Russell 2000 Price Forecasts for 2026 By Financial Analysts
|
Institution / Analyst |
2026 Year-End Target |
Market Outlook |
|
Knox Ridley (Portfolio Mgr) |
2,300 |
Caution: Sees a multi-quarter topping process. |
|
Jacob Shteyman |
2,600 |
Bullish: Prefers profitable S&P 600 names. |
|
CoinCodex (Technical) |
2,264 |
Bearish: Algorithm predicts a -9.9% dip. |
How to Trade the Russell 2000 (RTY) Index Futures on BingX
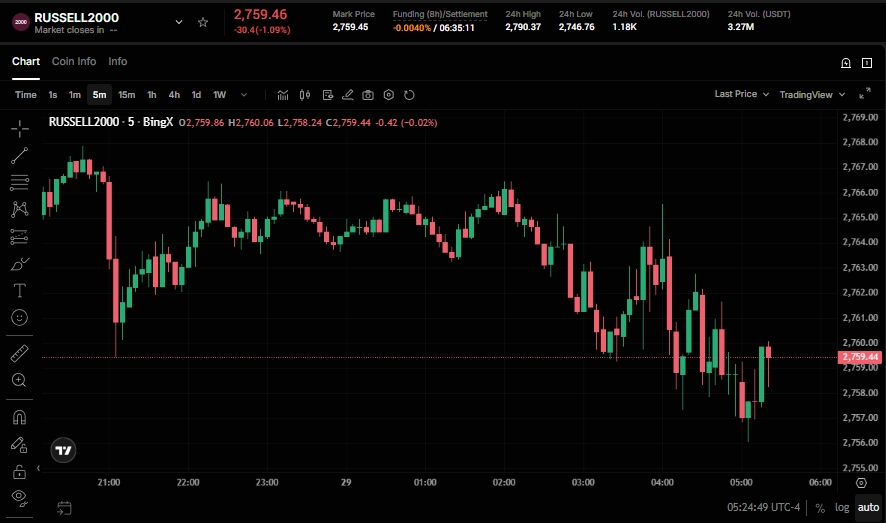
RUSSELL 2000 perpetuals on BingX futures market
Navigate the small-cap volatility of 2026 using BingX TradFi tools. Whether you are betting on the domestic breakout or hedging against debt-driven stress, BingX offers high-liquidity perpetual contracts with the power of BingX AI insights.
- Navigate to BingX TradFi and select Global Indices.
- Select the RUSSELL2000/USDT perpetual contract.
- Set your leverage, e.g., 2x–20x. Select Open Long if you anticipate further rate cuts, or Open Short to hedge against unprofitability risks.
- Set Take-Profit (TP) and Stop-Loss (SL) based on key levels.
Top 5 Risks to Watch When Investing in Russell 2000
While the small-cap sector offers high-growth potential in a falling-rate environment, investors must remain vigilant of structural and macroeconomic pitfalls that could derail the current breakout.
- Floating-Rate Debt Sensitivity: Although falling rates are a tailwind, a reversal in inflation that forces the Fed to pause or hike would disproportionately crush small-caps, many of which lack the fixed-rate cushions enjoyed by mega-caps.
- The Zombie Company Burden: With approximately 40% of the index currently unprofitable, the Russell 2000 is highly vulnerable to liquidity crunches; if private credit markets tighten, these zombie firms face significant bankruptcy risks.
- CapEx Pullbacks in Niche Tech: Many Russell 2000 constituents are pick-and-shovel providers for the AI and DeFAI sectors; a slowdown in infrastructure spending from hyperscalers like Microsoft or Meta would lead to sharp revenue misses for these smaller suppliers.
- Domestic Economic Softness: Unlike the internationally diversified S&P 500, the Russell 2000 is a pure play on the U.S. economy; any sudden spike in domestic unemployment or a sharp drop in consumer spending would hit small-cap industrials and retailers first.
- Cycle Convergence Volatility: As Gann’s 60-year Great Cycle and the Presidential Cycle converge in 2026, the risk of a Black Swan volatility event is historically elevated, potentially leading to systemic de-risking where investors flee small-caps for the perceived safety of cash or bonds.
Final Thoughts: Is the Russell 2000 Index a Buy in 2026?
The Russell 2000 in 2026 is a tale of two indices. For investors seeking a hedge against the Magnificent Seven exhaustion, small-caps offer a compelling domestic alternative powered by the Federal Reserve. However, the high percentage of zombie companies requires a disciplined approach. At the 2,400 level, the RTY is a tactical Buy on dips, provided the 10-year yield stays below 4.7%.
Risk Reminder: Trading small-cap indices involves high volatility and sensitivity to interest rate shifts. Always utilize stop-losses and perform your own due diligence.
Related Reading
- Nasdaq 100 (NAS100) Forecast 2026: 27,000 AI Breakthrough or 22,000 Stagflation Trap?
- S&P 500 Forecast 2026: 7,600 Bull Run or a 6,000 Energy-Driven Crash?
- Crude Oil Price Forecast 2026: $140 War Premium or $60 Surplus Baseline?
- How to Trade Stock Indices With Crypto as TradFi Goes On-Chain in 2026
- Direxion Daily SOXL ETF Forecast 2026: $200 Moonshot or Michael Burry’s Return to Earth Trap?
- Nikkei 225 Forecast 2026: 65,000 Milestone or Energy-Driven Stagflation?