



Texas Instruments (TXN) designs and manufactures analog and embedded-processing semiconductors used in industrial equipment, vehicles, data centers, personal electronics and communications systems. Analog products remain the largest revenue engine, while embedded processors connect sensing and control functions to digital systems. The broad portfolio and internal manufacturing network create durable scale advantages, but also expose the stock to inventory cycles, factory utilization and end-market demand.
The latest quarter showed that the analog recovery is broadening. Texas Instruments Q2 2026 revenue reached $5.463 billion, up 23% year over year, while Analog revenue grew 26% to $4.365 billion and Embedded Processing revenue rose 16% to $788 million. Trailing-12-month free cash flow climbed 271% to $6.534 billion, leaving investors to judge whether cyclical improvement can justify the stock's premium valuation.
The TXN stock forecast for 2026 now centers on two competing views:
- The data-center and manufacturing-leverage case: stronger power-management demand, industrial and automotive recovery, and rising utilization of 300mm factories could extend revenue growth while expanding operating margin and free cash flow.
- The cycle and capital-intensity case: renewed customer inventory correction, slower automotive demand or weak factory utilization could reduce earnings leverage while high capital requirements keep cash returns below the level implied by valuation.
This guide breaks down the TXN stock forecast, 2026 price scenarios, key risks and analyst outlooks, drawing on Texas Instruments' July 22 Q2 2026 earnings release, quarterly filing and market data through September 23, plus how to trade TXN stock futures on BingX TradFi with USDT collateral.
Top 5 Things for Texas Instruments Investors to Know in September 2026
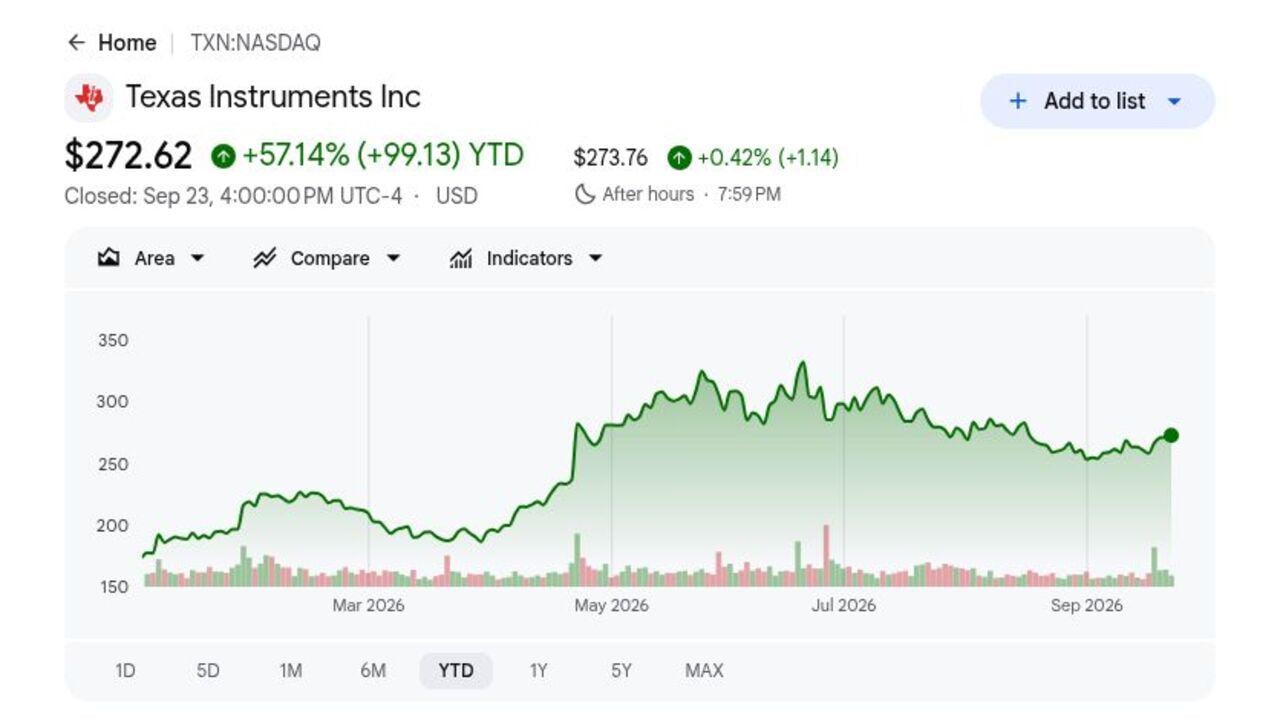
- TXN closed at $272.62 and was up 57.14% in 2026: Shares rallied on the analog recovery and stronger data-center demand but remained 18.4% below the $334.03 52-week high. The gap shows investors still question whether earnings growth can support a valuation above 40 times trailing earnings.
- Q2 revenue reached $5.463 billion, up 23%: Sales beat the $5.25 billion consensus by $213 million and increased 13% sequentially. Growth across industrial, data center, and automotive markets showed the recovery was broadening while factory utilization improved.
- Analog revenue rose 26% to $4.365 billion: The segment generated nearly 80% of quarterly sales, while Analog operating profit increased 50% to $1.992 billion. Higher volume through TI's 300mm manufacturing network supported stronger operating leverage.
- Q3 revenue guidance reached $5.65 billion to $6.15 billion: The $5.90 billion midpoint stood $290 million above the $5.61 billion consensus. EPS guidance of $2.23 to $2.57 also exceeded the $2.18 estimate at the low end.
- The quarterly dividend increased 7% to $1.52 per share: The increase marked 23 consecutive years of dividend growth and lifted the annualized payout to $6.08. Trailing free cash flow reached $6.534 billion, though continued factory investment still competes with dividends and buybacks.
What Is Texas Instruments (TXN)?

Texas Instruments is an integrated semiconductor manufacturer with more than 80,000 analog and embedded-processing products. Analog chips manage power, amplify signals and translate physical inputs such as temperature, pressure and sound into data that digital systems can process. Embedded processors provide real-time control and connectivity. TI sells primarily to electronics designers across industrial, automotive, data-center, personal-electronics and communications markets, while its catalog breadth and long product lives reduce dependence on any single customer or device cycle.
Its long-term strategy combines a broad product catalog with greater internal 300mm wafer capacity, which management expects to improve cost, supply control and geographic resilience. The company is expanding fabs in Sherman, Texas and Lehi, Utah, supported by U.S. CHIPS Act incentives, while targeting power management, sensing and control opportunities in electric vehicles, factory automation and AI infrastructure. Partnerships are usually embedded in customer designs rather than publicly concentrated contracts, making engineers, automotive suppliers, industrial equipment makers and cloud infrastructure builders the durable customer ecosystem.
Texas Instruments (TXN) Q2 2026 Earnings Overview: Strong Analog Growth Lifts Revenue, EPS and Q3 Outlook
Texas Instruments delivered Q2 revenue of $5.463 billion versus $5.25 billion expected, diluted EPS of $2.14 versus $1.94 expected, and net income of $1.980 billion, up 53% year over year. Analog revenue rose 26% to $4.365 billion, while Q3 revenue guidance of $5.65 billion to $6.15 billion exceeded the $5.61 billion consensus, balancing strong operating momentum against capital intensity and elevated expectations.
Read More: Texas Instruments (TXN) Q2 FY2026 Earnings Overview: $5.46B Revenue Beat Triggers a Price Selloff
|
Financial Metric |
Guidance / Consensus |
Reported / Actual |
Surprise |
|
Q2 revenue |
$5.25B consensus |
$5.463B |
Beat. Finished $213M above consensus; up 23% YoY and 13% sequentially. |
|
Q2 diluted EPS |
$1.94 consensus |
$2.14 |
Beat. Exceeded consensus by $0.20; up 52% YoY and included a $0.05 benefit. |
|
Q2 net income |
— |
$1.980B |
Improved. Increased 53% from $1.295B in Q2 2025. |
|
Q2 operating profit |
— |
$2.310B |
Expanded. Increased 48% from $1.563B as revenue scaled faster than costs. |
|
Q2 Analog revenue |
— |
$4.365B |
Accelerated. Rose 26% YoY while segment operating profit increased 50% to $1.992B. |
|
Q2 Embedded Processing revenue |
— |
$788M |
Improved. Rose 16% YoY while segment operating profit nearly doubled to $168M. |
|
Trailing-12-month free cash flow |
$1.763B prior year |
$6.534B |
Expanded. Increased 271% and represented 33.6% of trailing revenue. |
|
Q3 revenue outlook |
$5.61B consensus |
5.65B-6.15B |
Raised. The $5.90B midpoint stood $290M above consensus. |
|
Q3 EPS outlook |
$2.18 consensus |
2.23-2.57 |
Raised. The $2.40 midpoint stood $0.22 above consensus. |
- Revenue of $5.463 billion beat consensus by $213 million: Sales grew 23% year over year and 13% sequentially, showing the recovery had moved well beyond the cycle trough. Strength across industrial, data center, and automotive also suggests the beat was broad-based rather than driven by one end market.
- Diluted EPS of $2.14 beat consensus by $0.20: Earnings rose 52% from $1.41 a year earlier, even after excluding the $0.05 benefit outside original guidance. Higher factory utilization and a better product mix allowed revenue growth to translate into stronger per-share profit.
- Analog revenue reached $4.365 billion and grew 26%: Segment operating profit increased even faster, rising 50% to $1.992 billion. That supports TI's manufacturing-leverage thesis as higher volume spreads depreciation and fixed overhead across more chips.
- Operating profit rose 48% to $2.310 billion: Operating margin improved to about 42.3% from 35.1% a year earlier, while net income climbed 53% to $1.980 billion. Sustaining that progress depends on demand growth keeping factory utilization ahead of fixed-cost expansion.
- Trailing free cash flow rose 271% to $6.534 billion: Free-cash-flow margin improved to 33.6% despite $3.312 billion of trailing capital expenditures. The rebound supports dividend capacity, though new fab spending and higher depreciation remain key tests for cash-flow durability.
Texas Instruments (TXN) 2026 Investment Outlook: $380 Bull Case vs. $220 Bear Case
Texas Instruments' 2026 outlook depends on whether the analog recovery can extend beyond one strong quarter and translate into sustained margin and free-cash-flow growth. Stronger data-center, industrial, and automotive demand support the upside, while a renewed inventory slowdown, lower factory utilization, and valuation compression remain the main risks.
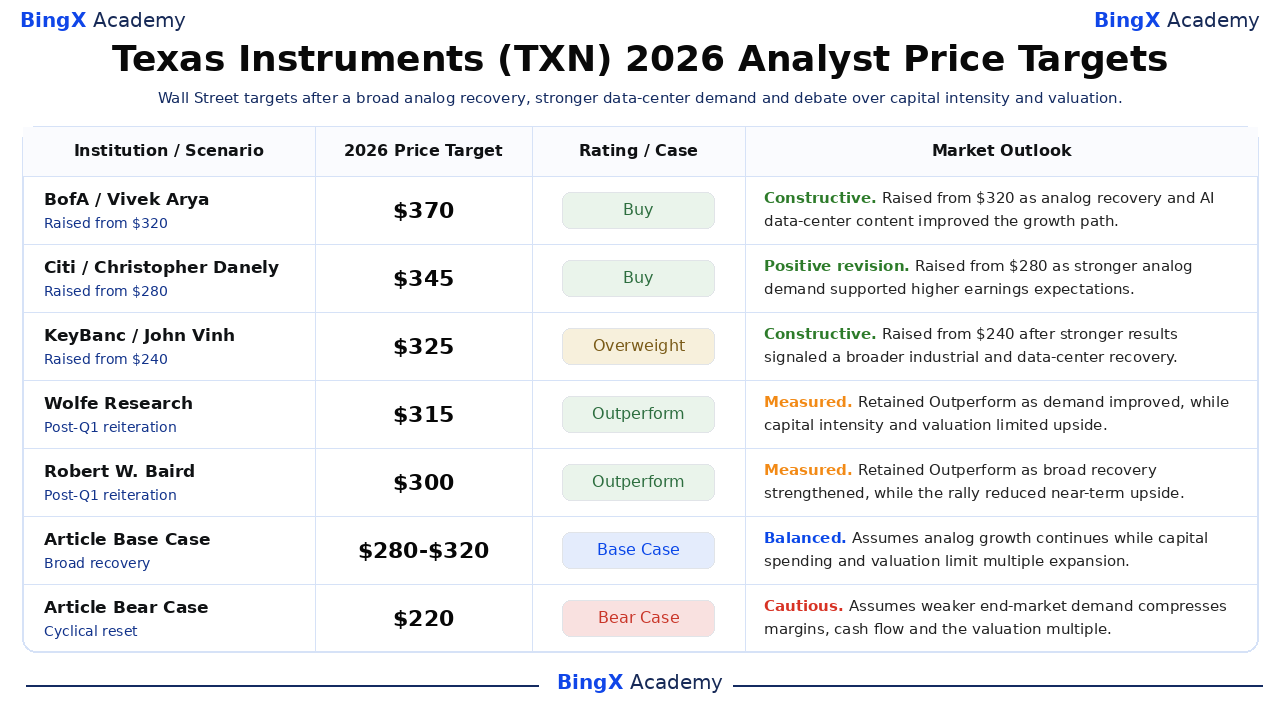
The Bull Case: Strong Data Center Demand Pushes TXN Toward $380
The Bull Case assumes data-center power demand stays strong while industrial and automotive customers move from inventory normalization into a sustained order recovery. Analog revenue continues growing from the Q2 level of $4.365 billion, 300mm utilization rises, and operating margin stays above 42% as fixed manufacturing costs spread across more units.
A move toward $380 would require Q3 revenue near or above the $5.90 billion guidance midpoint, trailing free cash flow above $6 billion and continued strength across power management, sensing and control. Further estimate upgrades and stable capital spending would strengthen the case.
The Base Case: Steady Analog Recovery Keeps TXN Between $280 and $320
The Base Case assumes demand remains constructive across industrial, automotive and data centers, but growth moderates after the 23% Q2 increase. Operating margin stays near 40%, while new capacity and depreciation absorb part of the incremental profit and limit further multiple expansion.
TXN could trade mainly between $280 and $320 under these conditions. Revenue within the $5.65 billion to $6.15 billion Q3 range, steady Analog growth and trailing free cash flow above $5 billion would support the range. Guidance below $5.6 billion would weaken the upper end.
The Bear Case: Slower Orders and Lower Factory Utilization Pull TXN Toward $220
The Bear Case assumes industrial or automotive customers rebuild inventory faster than end demand, causing orders to slow after the recovery quarter. Lower factory utilization would pressure the roughly 42.3% Q2 operating margin, while ongoing fab investment keeps depreciation and capital requirements elevated.
A move toward $220 would become more likely if quarterly revenue guidance falls below $5.6 billion, Analog growth turns negative or free cash flow moves back toward the prior year's $1.763 billion level. A valuation reset from more than 40 times trailing earnings would add further pressure.
TXN Stock Price Forecasts for 2026 By Wall Street Analysts
These five dated analyst actions span $300 to $370 and reflect different assumptions about analog-cycle durability, data-center demand, manufacturing leverage and valuation. They are third-party reference points rather than one consensus forecast. The final Base and Bear rows are BingX Academy editorial scenarios and are labeled separately.
|
Institution / Scenario |
2026 Price Target |
Rating / Case |
Market Outlook |
|
BofA / Vivek Arya |
$370 |
Buy |
Constructive. May 25: raised from $320 as industrial and automotive recovery combined with expanding AI data-center content. |
|
Citi / Christopher Danely |
$345 |
Buy |
Positive revision. June 15: raised from $280 as stronger analog demand supported higher earnings expectations. |
|
KeyBanc / John Vinh |
$325 |
Overweight |
Constructive. April 23: raised from $240 after stronger results signaled a broader industrial and data-center recovery. |
|
Wolfe Research / Chris Caso |
$315 |
Outperform |
Measured. April 23: retained Outperform as demand improved, while capital intensity and valuation limited upside. |
|
Robert W. Baird / Tristan Gerra |
$300 |
Outperform |
Measured. April 23: retained Outperform as broad recovery strengthened, while the rally reduced near-term upside. |
|
Article Base Case |
280-320 |
Base Case |
Balanced. Assumes analog growth continues while capital spending and valuation limit multiple expansion. |
|
Article Bear Case |
$220 |
Bear Case |
Cautious. Assumes weaker end-market demand compresses margins, cash flow and the valuation multiple. |
How to Trade Texas Instruments (TXN) Stock on BingX
Trade Texas Instruments' analog-cycle, data-center-demand and manufacturing-leverage outlook using BingX TradFi and BingX AI tools. Because TXN can react sharply to guidance, semiconductor orders and capital-spending updates, traders should define both the catalyst and risk limits before entering a position.
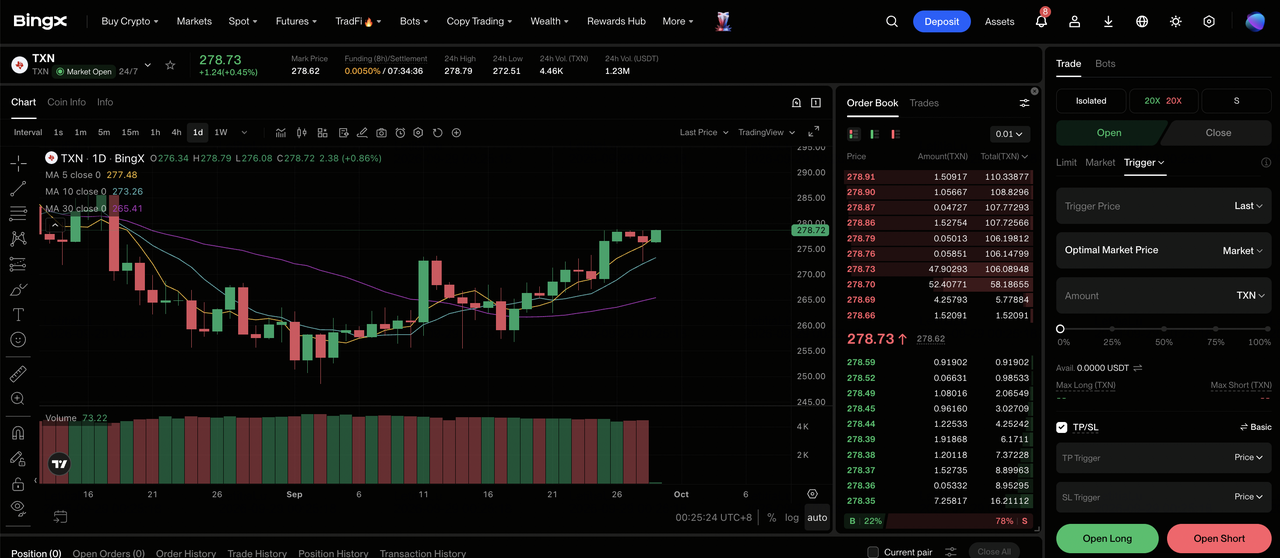
Step 1: Access BingX TradFi. Sign up and navigate to the specialized TradFi section on the BingX exchange dashboard.
Step 2: Select Texas Instruments (TXN). Search for and select the TXN-USDT perpetual futures contract.
Step 3: Choose your direction. Select Open Long if analog demand, data-center growth and free cash flow remain strong. Select Open Short if end-market orders, margins or cash conversion weaken.
Step 4: Select leverage and margin mode. Choose Isolated or Cross-Margin based on your risk tolerance. The 57.14% YTD gain and 18.4% pullback from the 52-week high show why conservative leverage and clear position sizing are important.
Step 5: Execute strict risk protocols. Set Take-Profit and Stop-Loss (TP/SL) levels before or immediately after entering the trade. TXN can react quickly to earnings, guidance, industrial orders, automotive demand, data-center spending, export controls and capital-allocation updates.
Top 5 Risks to Watch for Texas Instruments Investors in 2026
Texas Instruments combines cyclical demand with a long-term manufacturing expansion, so changes in orders, factory utilization, capital spending, and valuation can materially affect earnings and cash flow.
- A semiconductor downturn could lower factory utilization: Q2 revenue rose 23% as industrial, data-center, and automotive demand improved. If customers rebuild inventory faster than end demand grows, lower orders could leave more fixed fab costs spread across fewer units and pressure margins.
- Heavy capital spending can delay free-cash-flow growth: TI spent $3.312 billion on capital expenditures over the trailing 12 months while expanding 300mm capacity. A slower demand ramp could keep depreciation and construction costs elevated, limiting cash available for dividends and buybacks.
- A valuation above 40 times trailing earnings increases downside risk: TXN had gained 57.14% YTD before closing at $272.62. Slower growth, weaker guidance, or higher interest rates could compress the multiple even if earnings remain positive.
- Trade restrictions can disrupt global demand: TI serves customers across China, Europe, and other regions while expanding U.S. production. Export controls, tariffs, or localization policies could change demand, pricing, and product mix.
- Industrial and automotive orders can change quickly: These markets can reduce orders sharply when channel inventory rises above production needs. Another correction would pressure Analog and Embedded Processing revenue and reduce the margin benefit expected from higher 300mm utilization.
Final Thoughts: Should You Invest in Texas Instruments in 2026?
Texas Instruments entered the second half with broad operating momentum. Q2 revenue grew 23% to $5.463 billion, Analog sales rose 26% and trailing free cash flow reached $6.534 billion. Those figures support the recovery thesis, while the 57.14% YTD gain and continued fab investment show that substantial improvement is already reflected in valuation.
The Bull Case requires data-center power demand and industrial recovery to keep manufacturing utilization high, supporting $380. The Bear Case reflects a cyclical slowdown and multiple compression toward $220. Conservative traders may wait for Q3 revenue near the $5.90 billion midpoint, operating margin around 40% and continued free-cash-flow strength before increasing exposure.
Risk Reminder: Trading and investing in equities like TXN involves a high risk of capital loss. Semiconductor cycles, customer inventories, factory utilization, capital spending, trade policy, valuation changes and leveraged trading can produce rapid losses. Conduct independent research before allocating capital.
Related Reading
- Top 10 AI Infrastructure Stocks to Buy in 2026: Chip Manufacturing and Design Leaders
- Top AI Data Center Stocks to Buy in 2026: Cloud, Servers, and AI Compute Infrastructure
- Qualcomm (QCOM) Stock Forecast 2026: Can AI and Diversification Push QCOM Above $200?
- AXT Inc. (AXTI) Price Prediction 2026: Can AI Optical Demand Push AXTI Toward $125?
- Credo Technology (CRDO) Price Prediction 2026: $300 AEC Hyper-Ramp or Premium Valuation Speedbump?
- Applied Digital (APLD) Price Prediction 2026: Can AI Data Center Growth Push APLD Toward $90?
